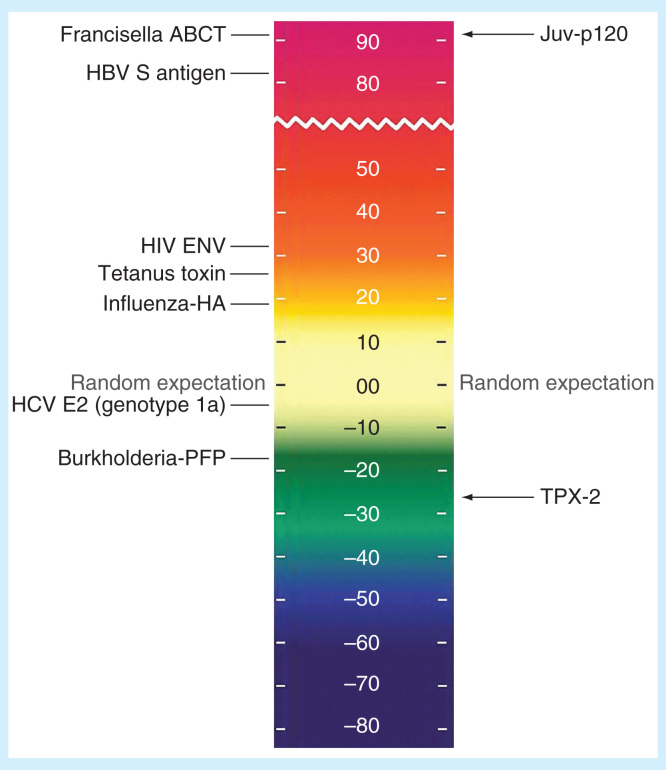
Figure 1.
Lymphatic filariasis antigens on the EpiMatrix protein immunogenicity scale. All other factors being equal, the more HLA ligands (i.e., putative T-cell epitopes) contained in a given protein, the more likely that protein is to induce an immune response. To capture this concept, the EpiMatrix immunogenicity scale presents proteins by the EpiMatrix protein score, and compares them to other known immunogens. The EpiMatrix protein score is the difference between the number of predicted T-cell epitopes expected in a protein of a given size and the number of putative epitopes predicted by the EpiMatrix. The EpiMatrix protein scores are ‘normalized’ and can be plotted on a standardized scale. ‘Average’ proteins score near zero. Protein scores above zero indicate the presence of excess MHC ligands and denote a higher potential for immunogenicity, while scores below zero indicate the presence of fewer potential MHC ligands than expected and a lower potential for immunogenicity. The EpiMatrix protein score is correlated with observed immunogenicity in vitro and in vivo. As shown here, proteins scoring above +20, such as Brugia malayi antigen Juv-p120, are considered to have a significant immunogenic potential. Proteins scoring below –20, such as TPX-2 above, are less likely to be immunogenic in vivo.

