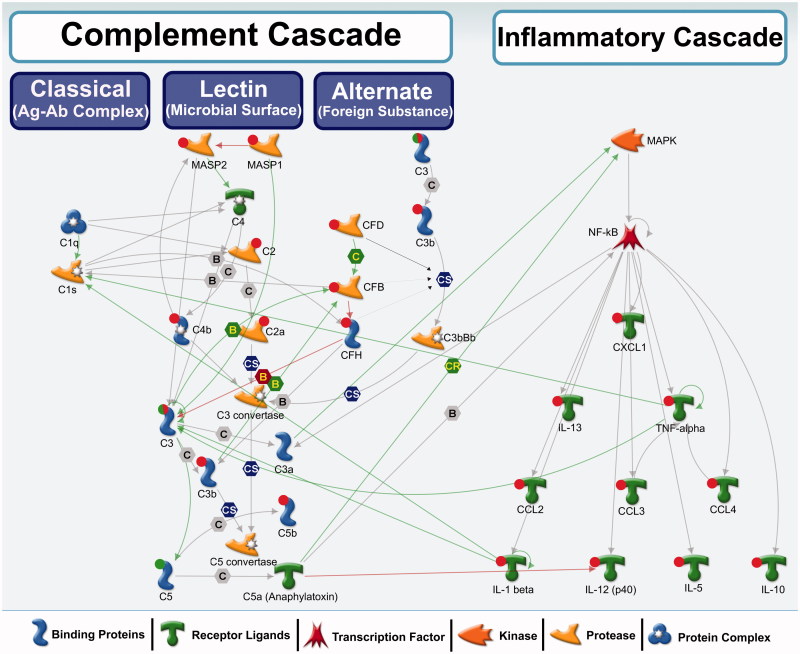
Figure 5.
A biological network showing interactions among complement cascade and inflammatory cascade genes/proteins. Red circle: up-regulation, green circle: down-regulation, both red and green: down-regulation of precursor and induction of the activated form. These genes were differentially regulated in this study. No circle: no change in expression or expression levels not measured in this study. Green arrows represent positive regulation/activation, brown arrows represent negative regulation/inhibition and grey arrows represent unspecified regulation. B – binding; C – cleavage; IE – influence on expression; CS – complex subunit; CR – complex group relations.

