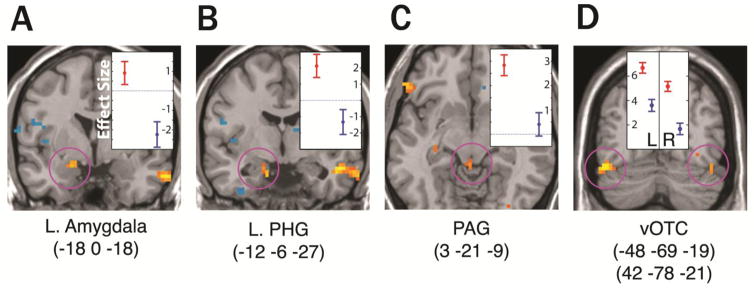
Figure 1.
Coronal (A,B,D) and axial (C) slices with group-level statistical results showing regions with significantly different BOLD response during the threat condition as compared to neutral (initial uncorrected voxel-wise threshold p<0.001 for the purpose of visualization). Highlighted findings survived correction for multiple comparisons at p<0.05 on peak voxels as described in the text. Plots show effect sizes with standard deviation error bars at cluster maxima (MNI coordinates below the image) in the threat vs. neutral contrast. Red = threat; Blue = neutral.

