Figure 3.
Amygdala Connectivity Analysis
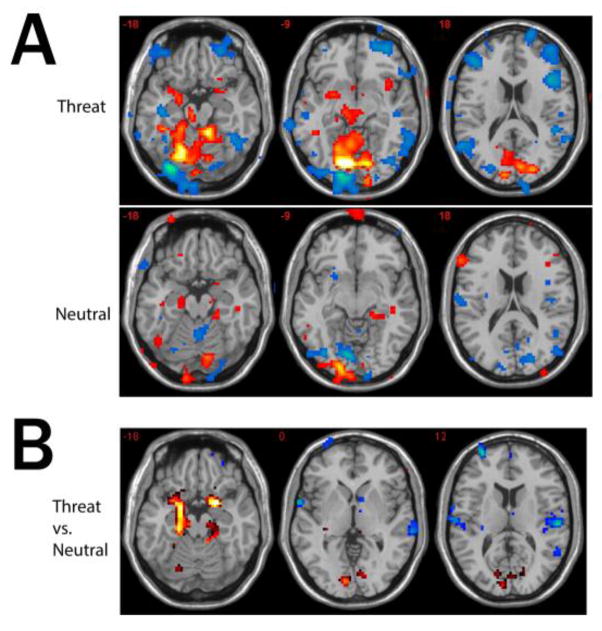
(A) Three axial slices showing voxels with significant (initial uncorrected voxel-wise threshold p<0.001 for the purpose of visualization) functional connectivity to the left amygdala during the threat and neutral conditions. Warm colors indicate positive correlations; cold colors indicate negative correlations. (B) Three axial slices showing significant differences in left amygdala functional connectivity between the threat and neutral conditions. Warm colors indicate positive differential connectivity, and cold colors indicate negative differential connectivity during the threat condition as compared to neutral.

