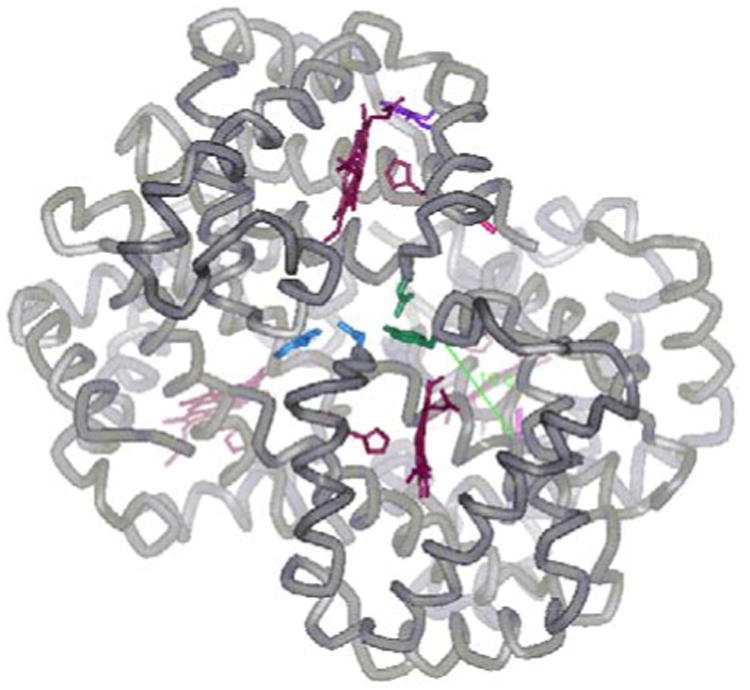
Figure 10.

The α1β2 interface. The α1β2 interface is depicted, with the α104 Cys highlighted in light pink, and the β93 Cys highlighted in dark pink. The residues forming intersubunit H-bonds (α42 Tyr and β99 Asp) and (β37 Trp and α94 Asp) are highlighted in green and blue respectively. The β85 Phe and β88 Leu residues of the 1β1-2β2 donor-acceptor interaction are shown in purple. Heme groups and coordinating His residues are shown in dark red. The Cα-Cα distance from the α104 Cys to the α42 Tyr (16.6 Å) is shown in green. Diagram was made using WebLab ViewerPro and the coordinates from the deoxy Hb S X-ray crystal structure (2HBS.PDB).
