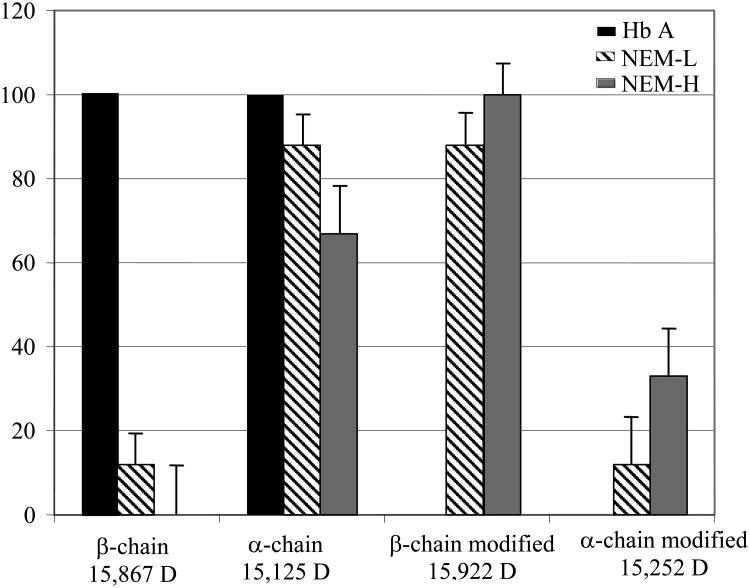
Figure 3.
Histogram of the percentage of chain labeling as determined by ESMS. Percentages were determined relative to unmodified Hb A. Samples of NEM-L Hb, NEM-H Hb and Hb A were prepared in a 0.1 M potassium phosphate, pH 7.1 buffer, at a concentration of 10 μM Hb. Data is also shown in Table 2.

