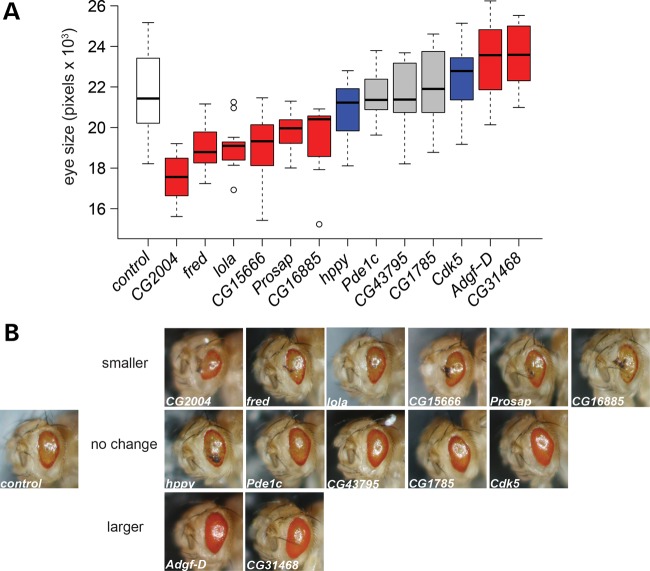
Figure 2.
Functional analysis of candidate genes. (A) The eye sizes for RNAi KD of candidate genes on the Rh1G69D background. White = AttP control; red = significantly different in size from AttP control (P); blue = not significantly different in size but shows clear qualitative change in eye phenotype (see B); gray = not significantly different from AttP control. In the box plots, the boxes represent the interquartile range, the whiskers represent 1.5 × interquartile range and open circles are outliers. See Supplementary Material, Table S7 for values and significance. (B) Representative examples of eyes from functional tests. All eyes are from flies carrying Rh1G69D. Control is on the left. RNAi KD eyes are shown in the order that they appear in (A). Note that hppy and Cdk5 KD eyes appear qualitatively different from the control, but do not show a difference in measured eye size. The control strain shown in (A and B) is the 60 100 AttP strain. This strain has the same genetic background for all the RNAi strains except CG2004, and thus serves as their control. CG2004 is on a different genetic background; its appropriate control strain is 60 000 AttP. Since we found that the two AttP control strains are indistinguishable in eye phenotype in the Rh1G69D background (Supplementary Material, Fig. S9), for simplicity, only the results for 60 100 AttP are shown here.

