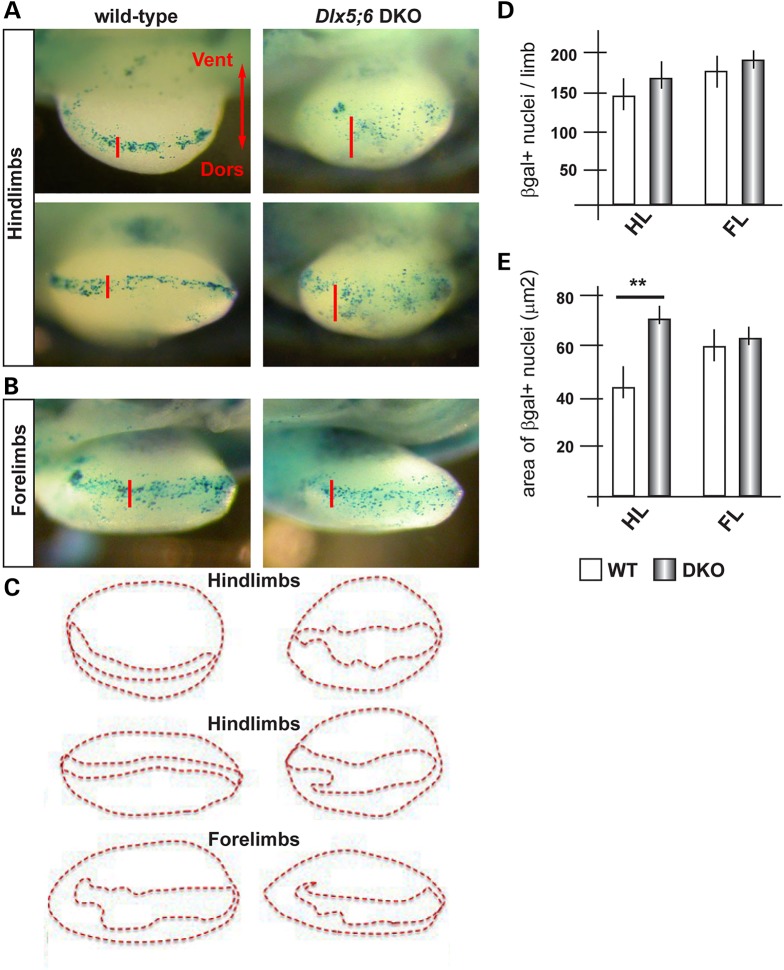
Figure 3.
Wnt/βcatenin-responsive cells in normal and Dlx5;6 DKO embryonic limbs. (A) Bright field images of X-gal-stained hindlimbs from WT (panels on the left) or Dlx5;6 DKO (panels on the right) embryos, at the age E11.5. These embryos were also heterozygous for the transgene BAT-lacZ. Red bars indicate the Do–Ve distribution of the β-gal+ nuclei at or near the AER. (B) Same as in (A), but forelimbs are shown. (C) Contours of the areas occupied by β-gal+ nuclei (B), used for the analysis in (E). (D and E) Quantification of the number of β-gal+ nuclei per limb, in the two genotypes (D) and quantification of the Do–Ve distribution of the same (E) per area (C). WT, open bars; Dlx mutant, patterned bars. Asterisks indicate statistical significance.

