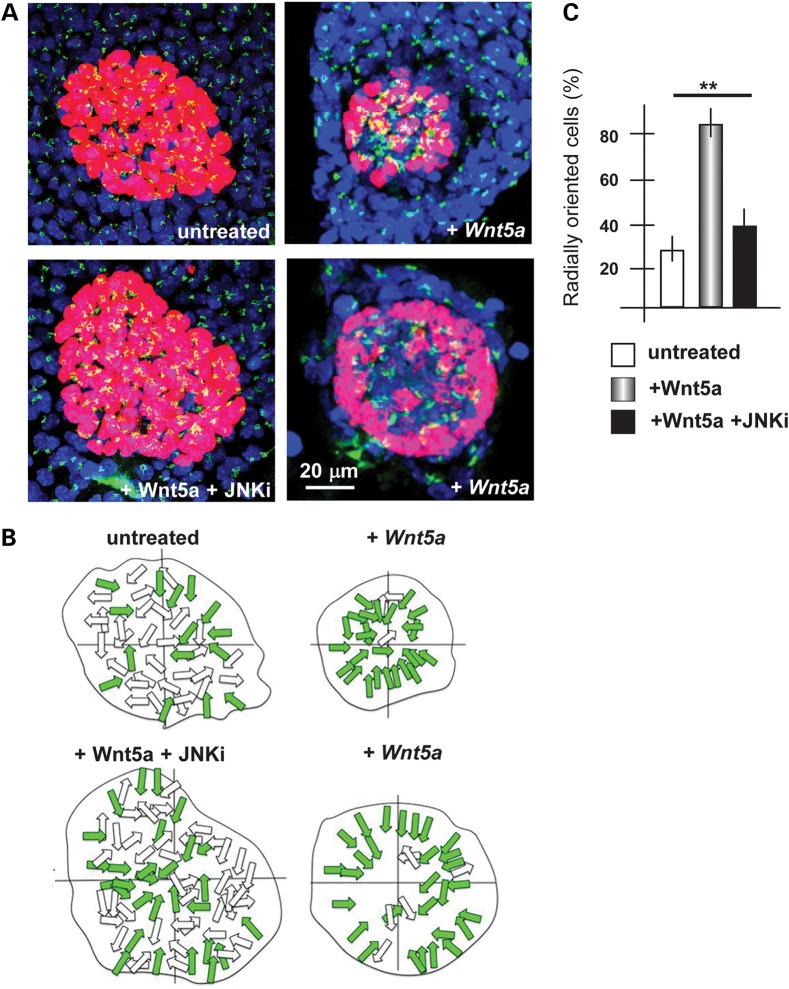
Figure 4.
Orientation of cultured primary ectodermal cells in response to Wnt5a. (A) Fluorescent micrographs of clumps of ectodermal cells, immunostained for p63 (red) and GM130 (green). Treatments are indicated below each panel. Scale bar is reported. (B) The schematic diagram of radially oriented (colored arrows) and non-radially oriented (open arrows) cells in each condition. (C) Quantification of the number of p63+ cells with the orientation of the Golgi apparatus radially respect to the nucleo, with respect to the total p63+ cells. Untreated, open bars; treated with Wnt5a, patterned bars; treated with Wnt5 + JNKi, solid black bars. Asterisks indicate the statistical significance.

