Figure 1.
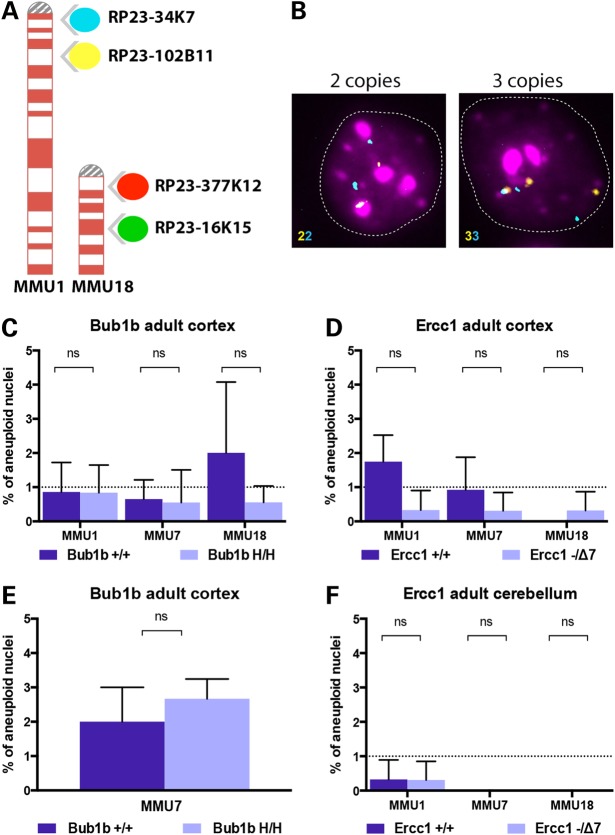
Probes used for FISH analysis and aneuploidy levels in adult mice. (A) Four differently labeled BAC clones (spectrum aqua, far red, spectrum orange and spectrum green) mapping to mouse chromosomes 1 and 18 at two distinct genomic loci enable the identification of diploid from aneuploid cells. (B) Two-color interphase FISH: the identification of whole chromosome loss or gain is determined by the numerical correspondence between the two colors. Representative hybridizations of cortical nuclei. Left panel shows a nucleus with two copies for MMU1 (2n) and right panel shows an aneuploid nucleus that contains three copies (gain). (C) Aneuploidy levels measured in the cortex of 6-month-old Bub1bH/H mice and age-matched controls. (D) Aneuploidy levels measured in the cortex of 14-week-old Ercc1−/Δ7 mice and age-matched controls. (E) Additional analysis of aneuploidy levels for MMU7 measured in the cortex of 6-month-old Bub1bH/H mice and age-matched controls. (F) Aneuploidy levels measured in the cerebellum of 14-week-old Ercc1−/Δ7 mice and age-matched controls. No statistically significant increase in aneuploidy was observed for the three chromosomes tested in these models at the selected time points.

