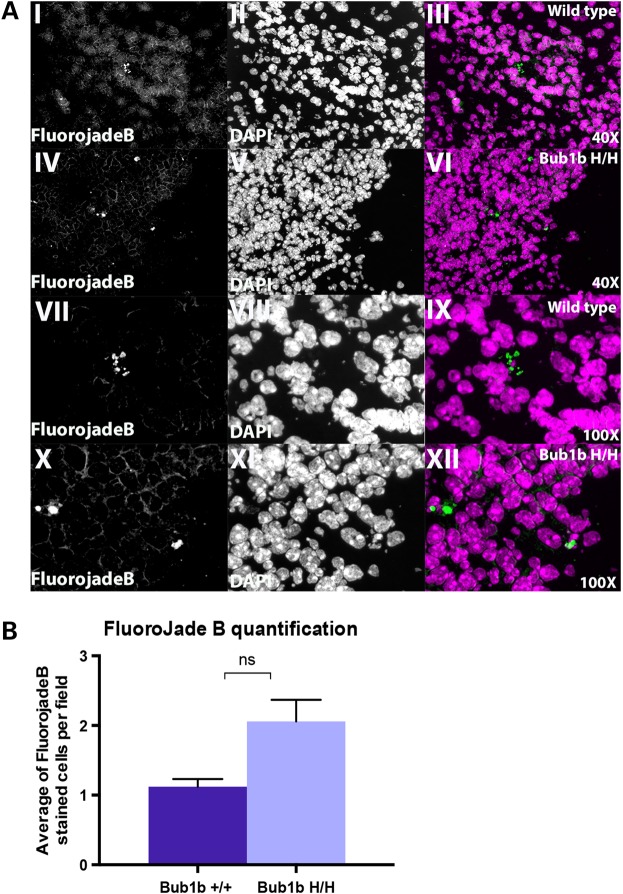
Figure 4.
Analysis of degenerating neurons by Fluoro-jade B labeling in the developing cortex. (A) Representative images from Fluoro-jade B staining in E13.5 WT and Bub1bH/H mice at 40× and 100× magnifications. (I and IV) 40× Fluoro-jade B staining only; (II and V) 40× DAPI nuclei staining only; (III and VI) 40× merged image; (VII and X) 100× Fluoro-jade B staining only; (VIII and XI) 100× DAPI nuclei staining only; (IX and XII) 100× merged image. (B) Quantification of Fluoro-jade B staining images represented as average of positively stained cells per 40× field per genotype. The difference is not statistically significant (P = 0.05612).

