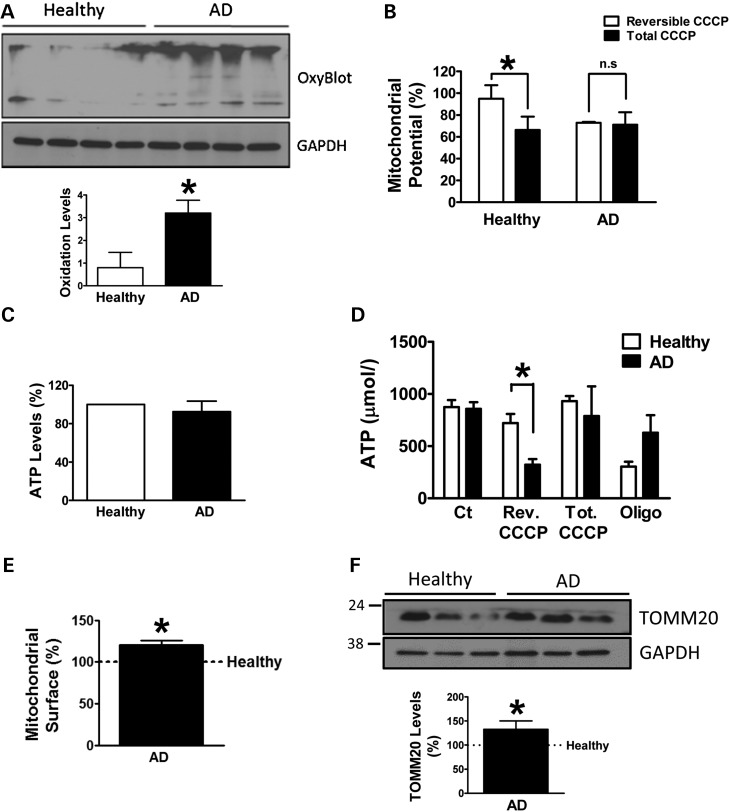
Figure 1.
Mitochondrial anomalies in SAD fibroblasts. (A) Representative OxyBlot showing oxidized proteins of healthy and SAD fibroblasts under basal conditions and quantification of the whole set of data by using the following healthy/AD sample couples: AG11362/AG05809, AG07803/AG06262, AG05813/AG06263 and AG07310/AG06869. (B) Mitochondrial membrane potential of fibroblasts reversibly treated with CCCP (20 μM) for 6 h and then allowed to recover for 1 h (reversible CCCP) or treated for 7 h with CCCP (total CCCP) using the following cells: AG07310/AG06869, AG11020/AG05810 and AG11362/AG05809. (C) Intracellular ATP measurement of healthy and SAD fibroblasts under basal conditions using the following cells: AG11362/AG05809, AG11020/AG05810, AG05813/AG06263 and AG07310/AG06869. (D) ATP measurement of fibroblasts reversibly treated as in (B) besides the treatment with oligomycin (10 μM) for 7 h. The graph shows representative experiment using AG07310/AG06869 samples performed in duplicate, although similar results were obtained using following cells: AG11362/AG05809 and AG07310/AG06869 (data not shown). (E) Quantification of the mitochondrial surface per cell by measuring the TOMM20 label when the cell limit was determined by phalloidin label in the confocal images as shown in Supplementary Material, Figure S1 using the following cells AG11362/AG05809, AG07803/AG06262 and AG05813/AG06263. (F) Representative western blot and quantification of TOMM20 expression under basal conditions using the cells AG11362/AG05809, AG07310/AG06869 and AG05813/AG06263. All graphs show means and standard deviations of the indicated healthy/AD age-matched couple samples. *P < 0.05.

