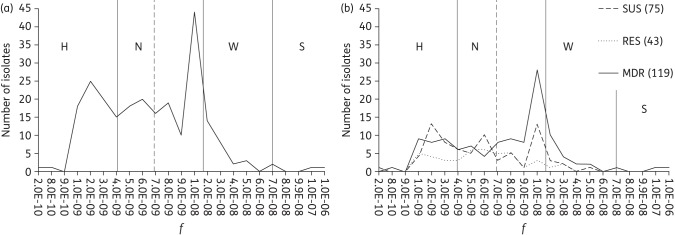
Figure 1.
Distribution of f of 237 A. baumannii isolates. (a) Vertical continuous lines indicate the division of isolates into categories by their mutability status: H, hypomutators (f ≤4 × 10⁻⁹); N, normomutators (4 × 10⁻⁹ < f < 1.7 × 10⁻⁸); W, weak mutators (1.7 × 10⁻⁸ < f < 7 × 10⁻⁸); and S, strong mutators (f >7 × 10⁻⁸).11,12 The vertical broken line indicates f for the control strain A. baumannii ATCC 19606 (7 × 10⁻⁹). (b) Distribution of f when isolates are divided according to their ARPGs. Numbers in brackets indicate numbers of isolates in respective ARPGs. SUS, susceptible; RES, resistant.

