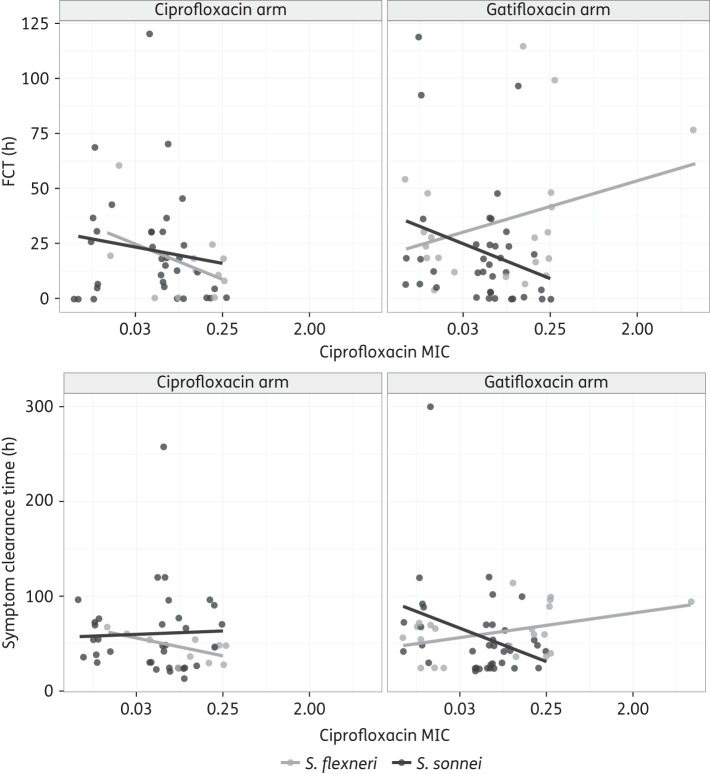
Figure 4.
Effect of MIC of ciprofloxacin (mg/L) on clinical outcome for S. sonnei and S. flexneri infections. Associations between ciprofloxacin and FCT (top two plots) and symptom clearance time (bottom two plots) are shown. Patients treated with ciprofloxacin are shown on the left and patients treated with gatifloxacin are on the right. Patients infected with S. sonnei are shown in dark grey and patients infected with S. flexneri are in light grey. The lines represent the best-fit linear model for each set of patients.

