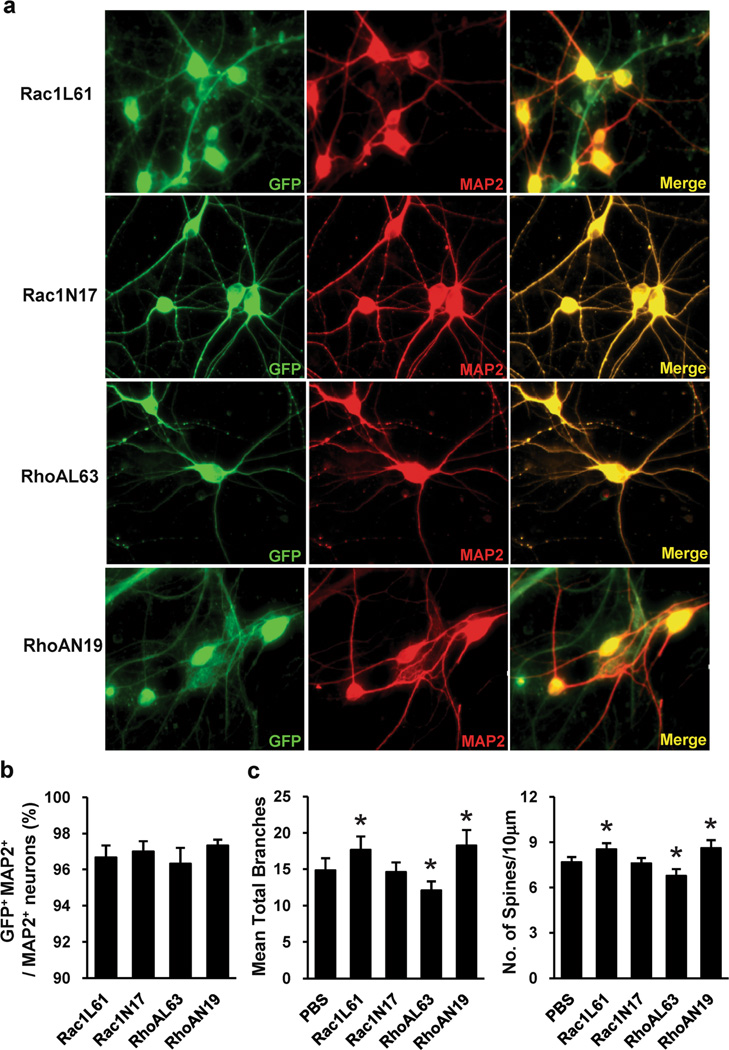
Fig. 3.
Rho GTPase mutant expression in PFC neurons. a Representative Images of PFC neurons after Rac1N17 and RhoAN19 lentivirus infection, staining with antibodies against GFP and MAP2. b Quantitation of the percentage of GFP-MAP2-double-positive (infected) neurons. The percentage of GFP-MAP2-double-positive neurons was determined by fluorescence microscopy, counting 30 microscopic fields per virus. Recombinant viruses infected >95 % of the neurons. Values are expressed as mean ± SEM. c The dendritic branching and dendritic spine density in PFC neurons expressing Rac1N17, Rac1L61, RhoAN19 or RhoAL63. The data are presented as the mean ± SEM. *p<0.05

