
Figure 2.
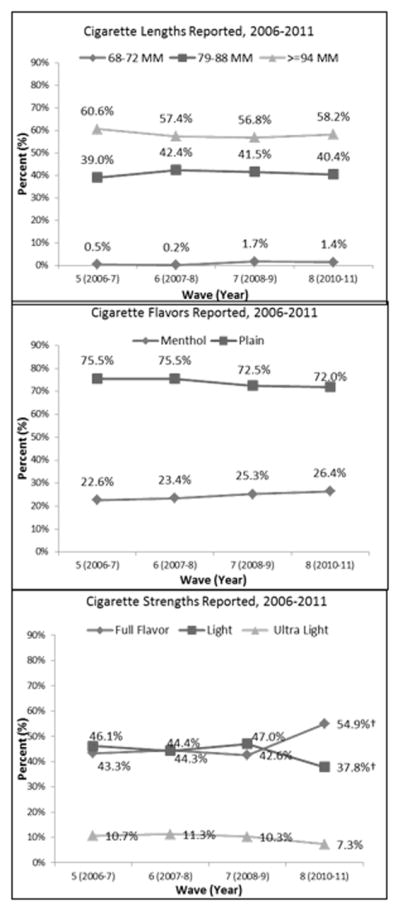
Cigarette flavors, sizes, and strengths reported by smokers between 2006–7 & 2010–11
†Statistically significant linear trend (p<0.01) in category from 2006–2011.
Percentages are adjusted for sex, age, wave, income, nicotine addiction, time-in-sample, daily smoking status, race, education, region, brand type.