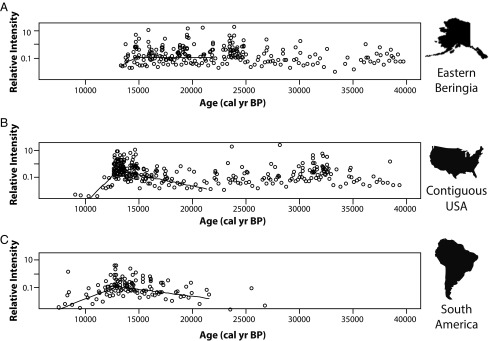
Fig. 1.
Comparison of estimated dates of initial megafaunal decline using generalized linear model analyses of taphonomically corrected spacing lengths for (A) EB, (B) the CUSA, and (C) SA. Inverse spacings (°) and inverse estimated mean lengths (—) are on a scale proportional to frequency of occurrence and are labeled as relative intensity. Times of descent (EB = 14,661; CUSA = 13,001; SA = 12,967 BP) correspond to estimated onset of decline for each region.

