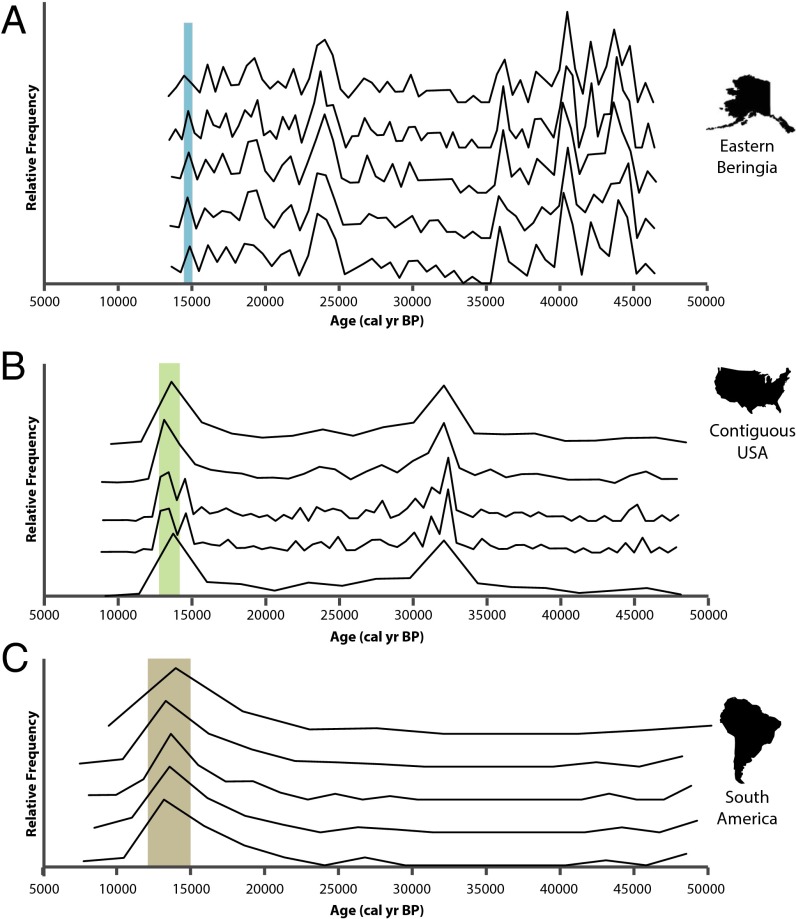
Fig. 2.
Taphonomically corrected calibrated radiocarbon frequency polygons for (A) EB, (B) the CUSA, and (C) SA. For each region, the optimal binning solution is presented for five histograms varying bin number with the highest likelihood values using the Hogg method. Colored rectangles represent the mean location of the final mode preceding extinction.

