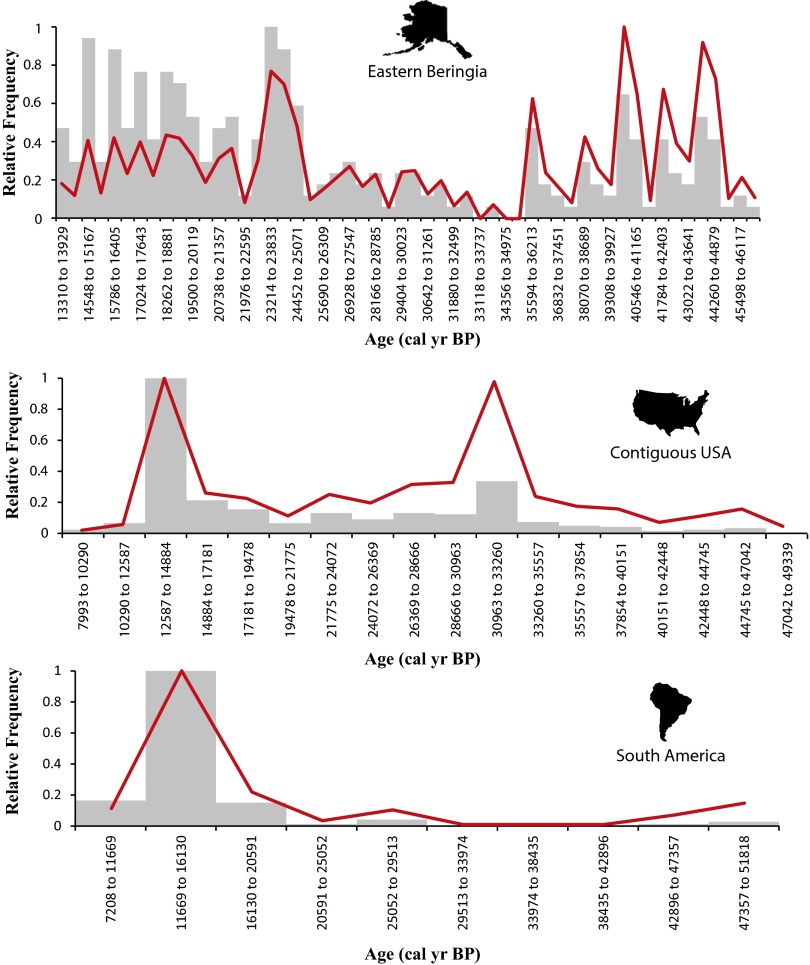
Fig. S2.
Optimal histogram binning for EB (54 bins), the CUSA (18 bins), and SA (10 bins) comparing raw date frequencies (gray bars) and taphonomically corrected frequencies (red lines). Over long time scales, the taphonomic correction process can have major effects on the shapes of curves, but over short time scales (<4,000 y), the effects are minimal. Therefore, unless adjacent bin frequencies are very similar, taphonomic correction does not affect the position of the last major mode before extinction.

