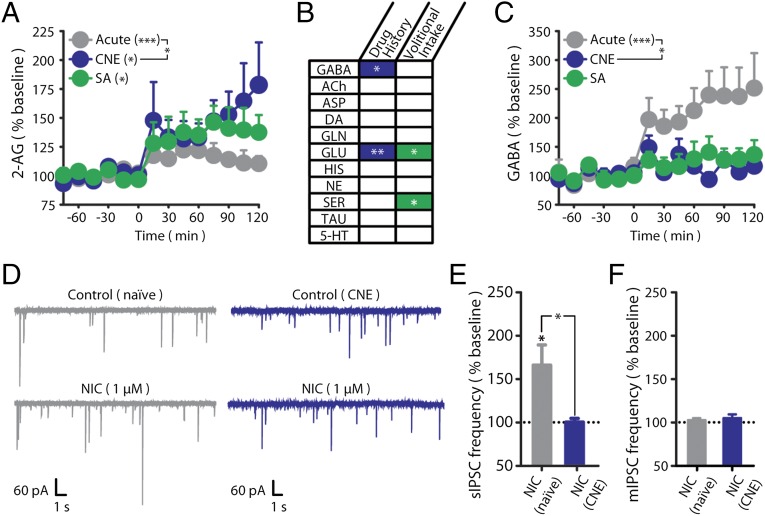
Fig. 1.
Chronic nicotine exposure impairs nicotine-induced GABA release in the rat VTA. (A) Dialysate 2-AG levels before (t −60 to 0 min) and during (t 0–120 min) nicotine exposure in naïve (n = 7), CNE (n = 7), and SA (n = 6) rats. Reprinted by permission from Macmillan Publishers Ltd. (14). (B) Summary of microdialysate neurotransmitter changes between groups during nicotine exposure. Corresponding microdialysate profiles are shown in Fig. S1. (C) Dialysate GABA levels before (t −60 to 0 min) and during (t 0–120 min) nicotine exposure in naïve (n = 7), CNE (n = 7), and SA (n = 6) rats. Baseline GABA levels did not significantly differ between groups. (D) Representative recordings of sIPSCs in VTA DA neurons from naïve (Left) and CNE (Right) rats during the superfusion of 1 µM nicotine (NIC). (E) Summary of sIPSC frequency during superfusion of 1 µM nicotine in VTA DA neurons relative to baseline (dashed line) from naïve (n = 7) and CNE (n = 6) rats. (F) Summary of mIPSC frequency during superfusion of 1 µM nicotine in VTA DA neurons relative to baseline (dashed line) revealed in the presence of 0.5 µM TTX [naïve (n = 6), CNE (n = 8); representative traces are in Fig. S3C]. Dashed lines reflect prenicotine baseline levels (defined as 100%). Data are presented as mean ± SE. *P < 0.05, **P < 0.01, ***P < 0.001.

