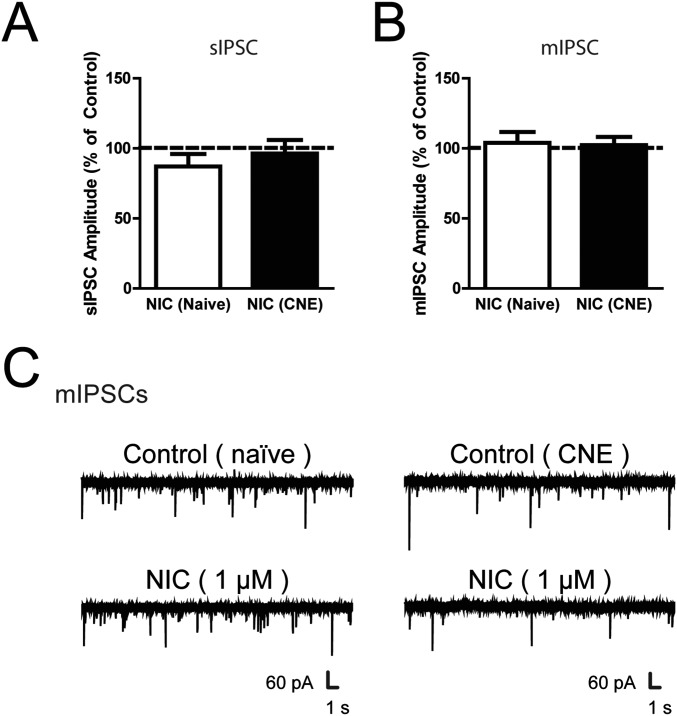
Fig. S3.
VTA dopamine neurons following nicotine exposure. (A and B) Summary of the change in (A) sIPSC and (B) mIPSC amplitude in VTA DA neurons from naïve and CNE rats following 1 μM nicotine. (C) Representative voltage-clamp recordings of mIPSCs in VTA DA neurons from naïve (Left) and CNE (Right) rats during the superfusion of 1 µM nicotine. Data are presented as mean ± SE.

