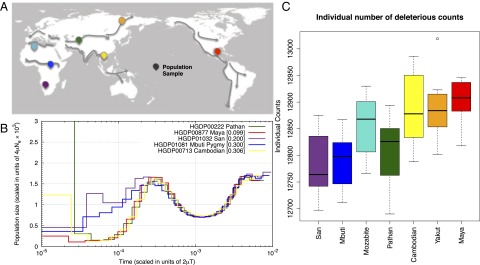
Fig. 1.
Decrease in heterozygosity and estimated Ne with distance from southern Africa. (A) Locations of HGDP populations sampled for genome and exome sequencing are indicated on the map. Putative migration paths after the origin of modern humans are indicated with arrows (adapted from ref. 46). (B) PSMC curves for individual genomes, corrected for differences in coverage. Whereas populations experiencing an OOA bottleneck have substantially reduced Ne, African populations also display a reduction in Ne between ∼100 kya and 30 kya (see SI Appendix for simulations of population history with resulting PSMC curves). (C) For each individual’s exome, the number of putatively deleterious variants (equivalent to number of heterozygotes + twice the number of derived homozygotes) is shown by population.

