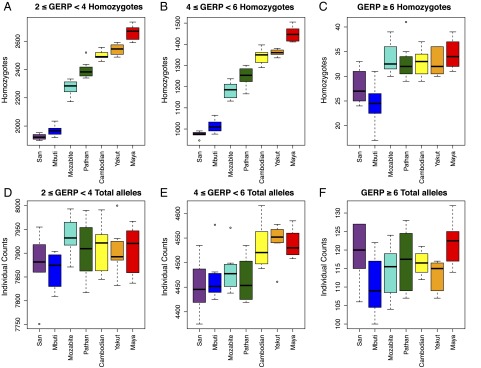
Fig. 2.
Individual counts of deleterious variants. (A–C) For each individual’s exome, the number of derived homozygotes is plotted by population for moderate-, large-, and extreme-effect GERP categories. (D–F) For each individual’s exome, the number of derived variants (equivalent to number of heterozygotes + twice the number of homozygotes) is plotted by population for moderate-, large-, and extreme-effect GERP categories.

