Fig. 3.
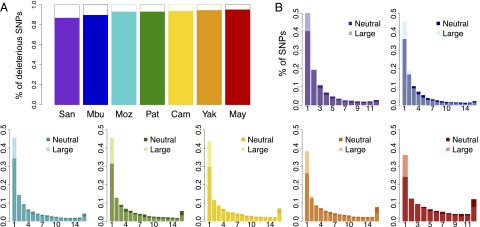
Differences in the proportion of deleterious alleles by frequency class. (A) The proportion of rare versus common deleterious variants per individual. For a given individual, deleterious variants were divided into common (>10%, solid colors) and rare (<10%, white space). The contribution of common deleterious variants to an individual’s burden is much greater than rare variants. (B) For each population, we calculated the proportional site frequency spectrum by plotting the proportion of deleterious large-effect alleles in each frequency class (translucent coloring) along with the proportion of neutral alleles for each frequency class (opaque coloring). African populations have proportionally fewer rare deleterious alleles than expected from neutrality. Populations with OOA ancestry have proportionally more fixed deleterious mutations.

