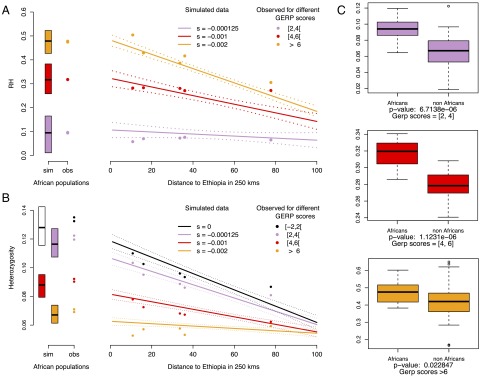
Fig. 4.
Heterozygosity under range expansion simulations with different selection coefficients. (A) Observed and simulated patterns of the reduction of heterozygosity (RH). Selection coefficients used in the simulations are s = 0 (black), s = −0.000125 (lavender), s = −0.001 (red), and s = −0.002 (orange). (B) Colored circles show average expected heterozygosity for populations with ancestry from the OOA bottleneck. Solid lines show the regression lines obtained from simulations and dashed lines indicate 95% confidence intervals for the regression. The boxplots and colored circles on the left show the simulated heterozygosities in ancestral (i.e., African) populations, and the observed heterozygosity in our African dataset (San/Mbuti), respectively. (C) Comparison of the distribution of RH between African and non-African individuals for different GERP categories, tested with a two-tailed Student t test (SI Appendix, Fig. S15).

