Fig. 4.
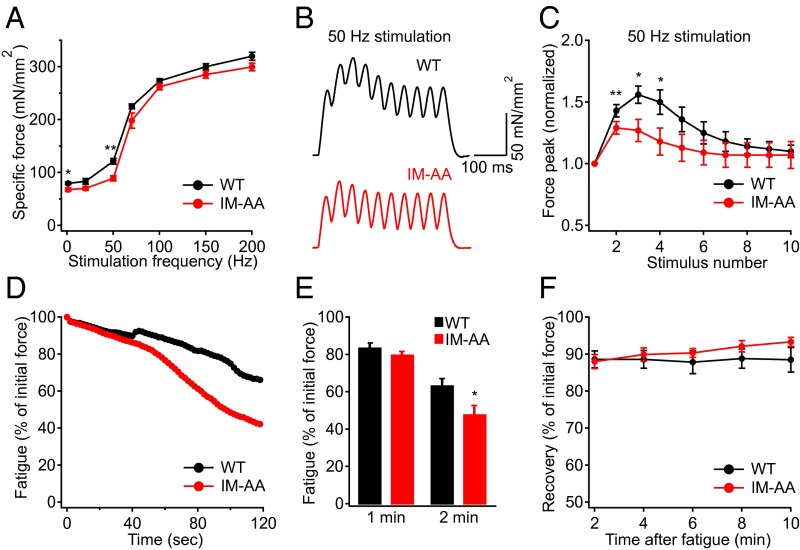
IM-AA mice exhibit impaired muscle function during direct nerve stimulation. (A) Specific force of TA muscle measured at various stimulation frequencies in WT (black; n = 4) and IM-AA (red; n = 4) mice. (B) Representative traces showing the force peaks during each stimulus in WT (black) and IM-AA (red) muscles stimulated at 50 Hz. (C) Pooled data showing the force peaks, normalized to the first peak, for each stimulus of a 50-Hz contraction in WT (black; n = 4) and IM-AA (red; n = 4) mice. (D) Representative traces showing the force decline during a muscle fatigue protocol over 2 min in WT (black) and IM-AA (red) mice. (E) Pooled data showing the force after 1 min or 2 min of fatigue in WT (black; n = 5) and IM-AA (red; n = 5) mice. (F) Pooled data showing the force recovery for 10 min after muscle fatigue in WT (black; n = 5) and IM-AA (red; n = 5) mice. *P < 0.05; **P < 0.01.

