Fig. 1.
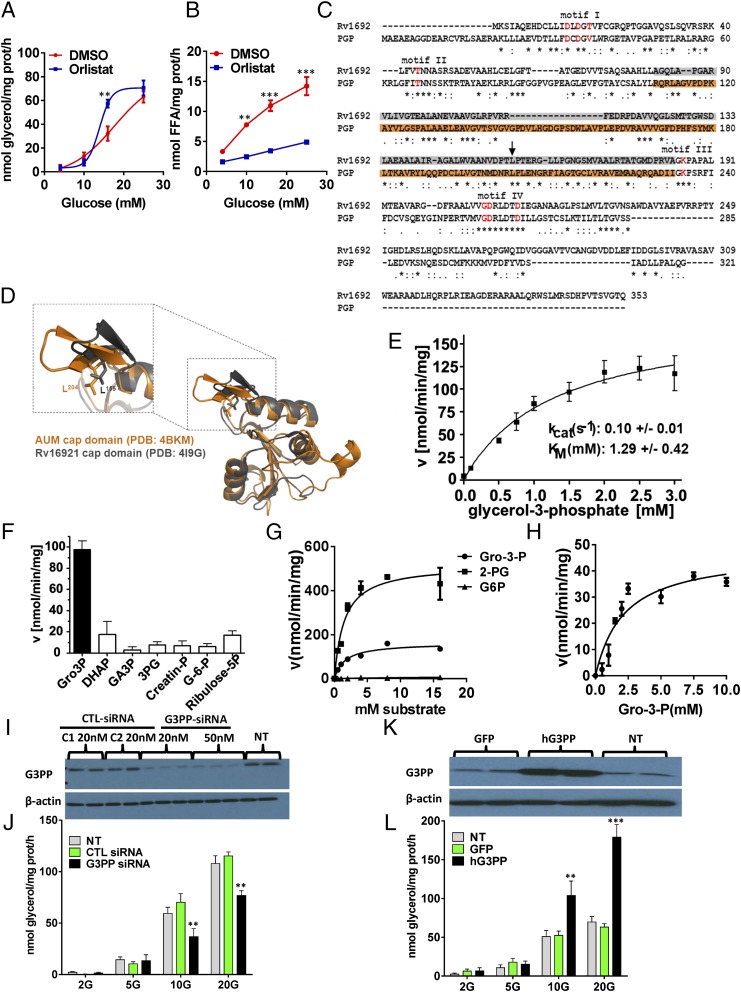
Identification of PGP as a G3PP and its effect on glycerol release in rat islet cells and INS832/13 β cells. (A and B) Glycerol and FFA release (2 h) by isolated rat islets at 4, 10, 16, and 25 mM glucose with and without 50 μM orlistat (means ± SEM of four independent experiments with triplicate observations; **P < 0.01 and ***P < 0.001). (C and D) Alignment of murine PGP (mPGP) and G3PP of Mycobacterium tuberculosis (Rv1692). (C) There is a very high degree of sequence homology (P < 4 × 10⁻²⁰) and all active-site residues (in red) match exactly. (D) The cap-domains, which determine substrate specificity (in orange for mPGP and gray for Rv1692) align nearly perfectly, as does the critical leucine residue at position 204 in PGP and 155 in Rv1692 (C, black arrow). (E) Kinetics of Gro3P hydrolysis by purified mPGP (mean ± SEM from eight experiments). (F) Purified mPGP hydrolyzes Gro3P more effectively than related compounds (mean ± SEM of five experiments). creatine-P, creatine phosphate; G-6-P, glucose-6-phosphate; GA3P, d,l-glyceraldehyde-3-phosphate; 3PG, D(-)3-phosphoglycerate; ribose-5P, ribulose-5-phosphate. (G) Kinetics of Gro3P, 2-PG, and glucose-6-phosphate (G-6-P) hydrolysis by overexpressed human G3PP in 293T cell extracts (mean ± SEM; n = 4). (H) Kinetics of Gro3P hydrolysis by native rat G3PP in INS832/13 cell extracts (mean ± SEM; n = 4). (I and J) RNAi knockdown of PGP/ G3PP in INS832/13 cells reduces glucose-induced glycerol release. (I) PGP/G3PP protein expression 48 h after transfection with 20 nM and 50 nM G3Pase siRNA or control siRNA C1 and C2 or in nontransfected (NT) cells. (J) Glycerol release (2 h) with and without RNAi knockdown at 2, 5, 10, and 20 mM glucose [mean ± SEM; n = 4; **P < 0.01 vs. control (CTL) cells]. (K and L) Overexpression of hG3Pase in INS832/13 cells enhances glucose-induced glycerol release. (K) hPGP/G3PP protein expression after transfection with GFP and G3PP expression plasmids and in nontransfected cells. (L) Glycerol release at 2, 5, 10, and 20 mM glucose (mean ± SEM; n = 4; **P < 0.01 and ***P < 0.001 vs. GFP control cells).

