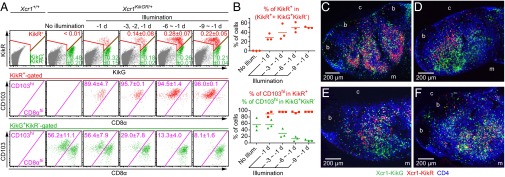
Fig. 3.
Photoconversion-based fluorescent labeling of Xcr1-expressing CD103hi migratory DCs and Xcr1-expressing CD8αhi resident DCs in the SDLNs. (A) Flow cytometry of inguinal LN cells from Xcr1KikGR/+ mice illuminated with violet-blue light at the indicated time points. Values represent mean ± SEM (n = 3). (B) Percentage of the indicated cell populations. Each symbol represents one mouse. (C–F) Confocal images of halves of inguinal LN sagittal slices from Xcr1KikGR/+ mice illuminated with violet-blue light once a day for 9 d (C), 1 d before analysis (D), 2 d before analysis (E), and 3 d before analysis (F). Shown is an x–y plane approximately 20 μm deep from the vibratome slice surface. “b,” “c,” and “m” indicate B-cell follicle, cortical side, and medullary side, respectively.

