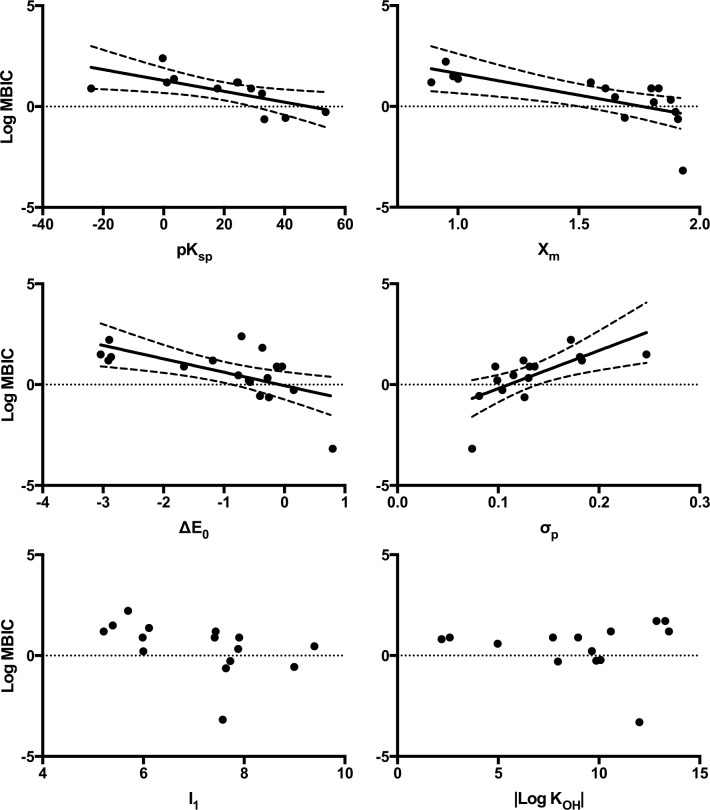
Fig 2. Linear regression analysis of MBIC values plotted against physicochemical parameters for OSPW consortia.
MBIC correlations with physicochemical parameters illustrate a typical metal susceptibility profile of the OSPW community. Parameters include: metal-sulfide solubility product (pKsp), electronegativity (Xm), standard reduction-oxidation potentials (ΔE0), Pearson’s softness index (σp), first ionization energy (I1), and first hydrolysis constant (|Log KOH|). Trend lines and 95% confidence bands (dashed lines) shown on linear regressions that correlate with significance.

