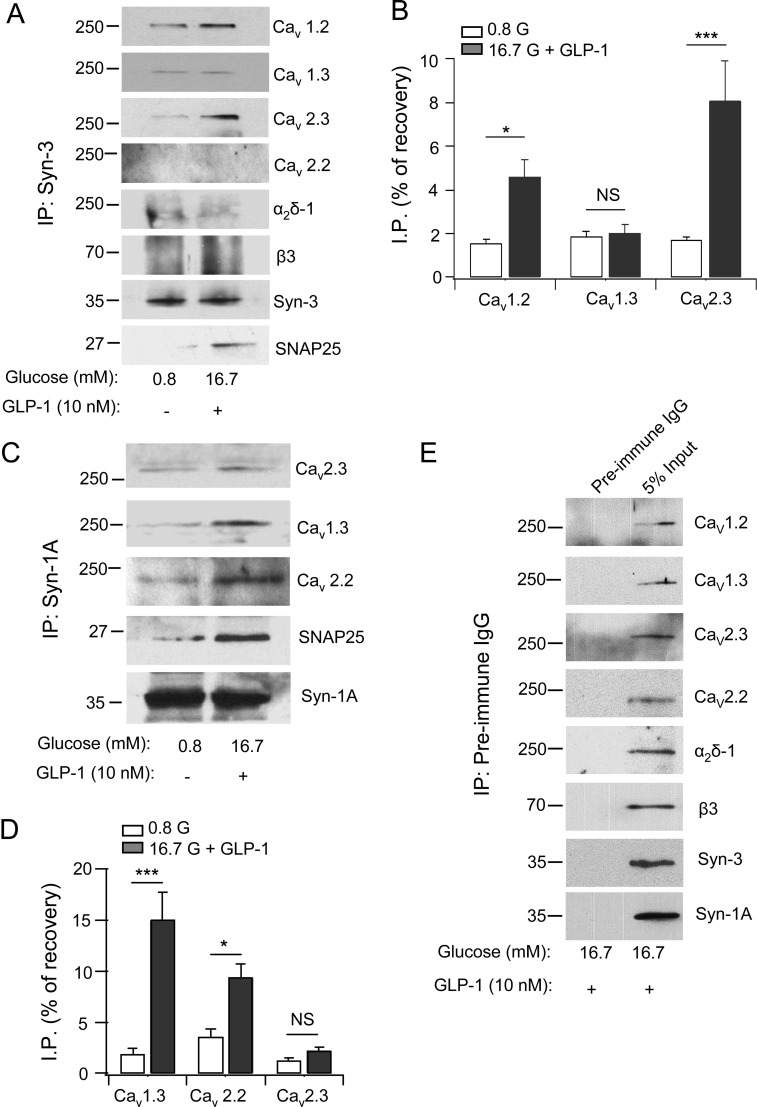
Fig 1. Syn-3 co-immunoprecipitates (IP) distinct Cavs than Syn-1A in INS-1 cells.
Syn-3 (A) and Syn-1A (C) interactions with the indicated Cavα1 subunits (Cav1.2, Cav1.3, Cav2.3 and Cav2.2) and auxiliary subunits (α2δ-1 and β3) and SNAP25 in INS-1 cells. Densitometric analysis of Syn-3 co-IP (B) and Syn-1A co-IP (D), expressed as percent recovery of total lysate inputs (which showed equal protein loading in S1 Fig), shows that high glucose (16.7 mM) plus GLP-1 (10 nM) increased the association of these syntaxins with the respective Cavs. Values are means±SEM, n = 3. *p<0.05, ***p<0.001, NS: not significant. As control (E) shows representative blots from five separate co-IP experiments with pre-immune IgG, which did not bring down syntaxins or Cavs (left lanes). Right lanes show the input lysates. All five experiments probed for the Cav α subunits and α2δ-1, whereas β3, Syn-3 and Syn-1A were probed on two blots from separate experiments.

