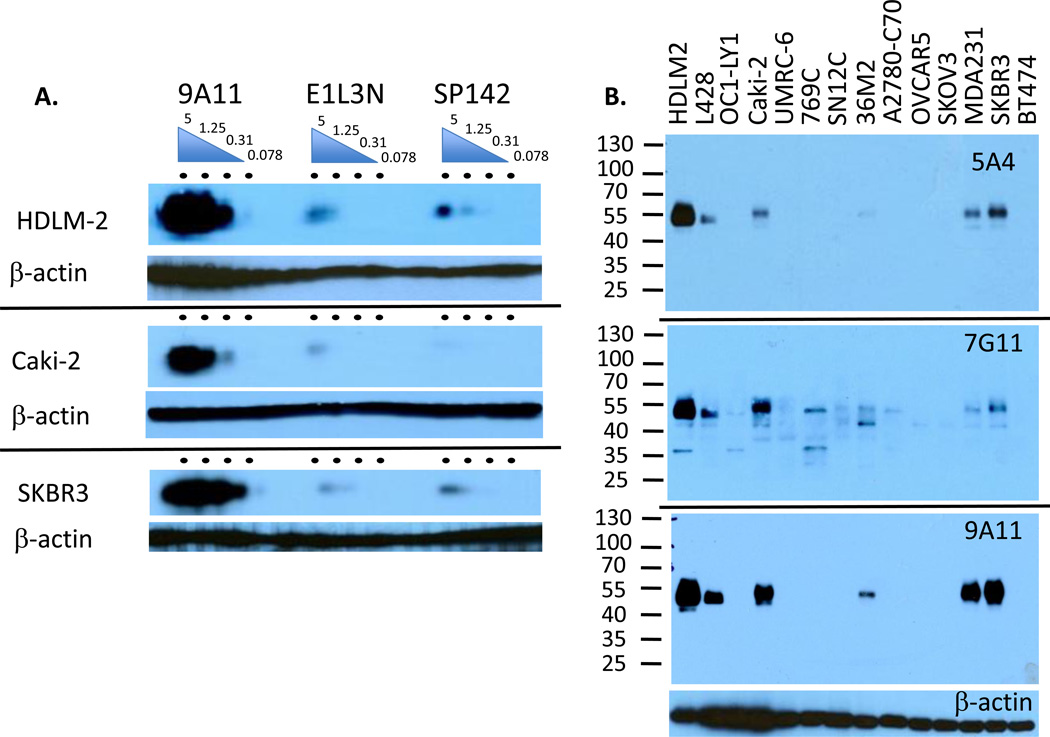
Figure 2.
Western blotting of PD-L1 mAbs. A. Multi-channel western blot analysis with dose curve of each antibody (5, 1.25, 0.31 and 0.078 µg/ml per lane) on HDLM2, Caki-2, or SKBR3, as indicated. Blot was developed with an equal mixture of anti-mouse and anti-rabbit IgG-HRP antibodies. B. Western blot analysis of hematologic (HDLM2, L428, OC1-LY1), kidney (Caki-2, UMRC-6, 769C, SN12C), ovarian (36M2, A2780-C70, OVCAR3), and breast cancer cell lines (MDA231, SKBR3, BT474) with anti-PD-L1 mAbs: 5A4 (10 µg/ml), 7G11 (20 µg/ml), 9A11 (5µg/ml) or anti-β-actin A and B are representative of 2–5 experiments.

