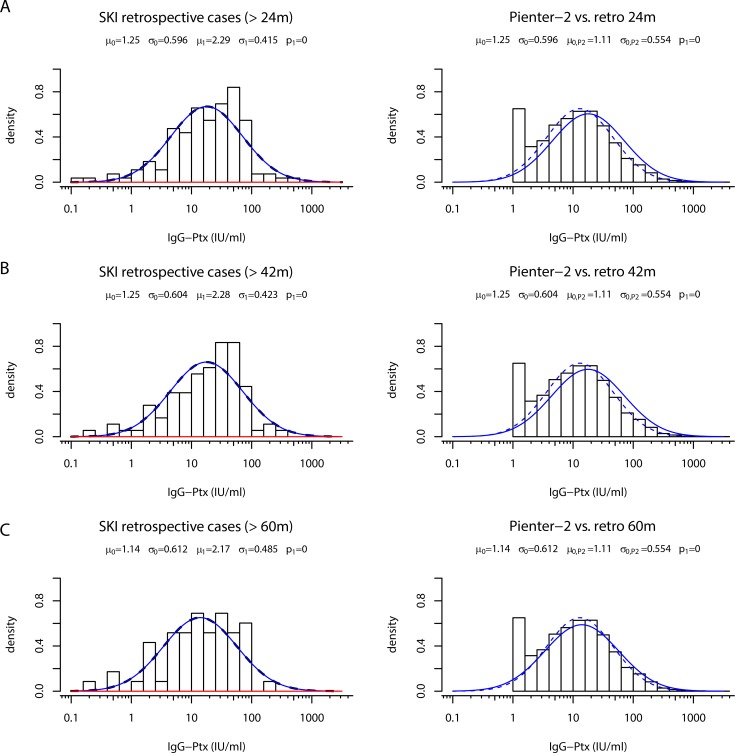
Fig 7. Time shift analysis of the negative IgG-Ptx component of SKI retrospective cases and overlay with PIENTER-2 data.
Left panels: Density distribution of IgG-Ptx (IU/ml) in samples obtained from retrospective cases (bars) having τ >24 months (A), τ >42 months (B), or τ >60 months (C), respectively. Lines indicate the fitted negative (blue line) and positive (red line). Right panels: Density distribution of IgG-Ptx (IU/ml) in samples obtained from the PIENTER-2 study (bars + dotted line), the blue line indicates the time shifted overlay of the retrospective cases indicated in the left panel.

