
Figure 2.
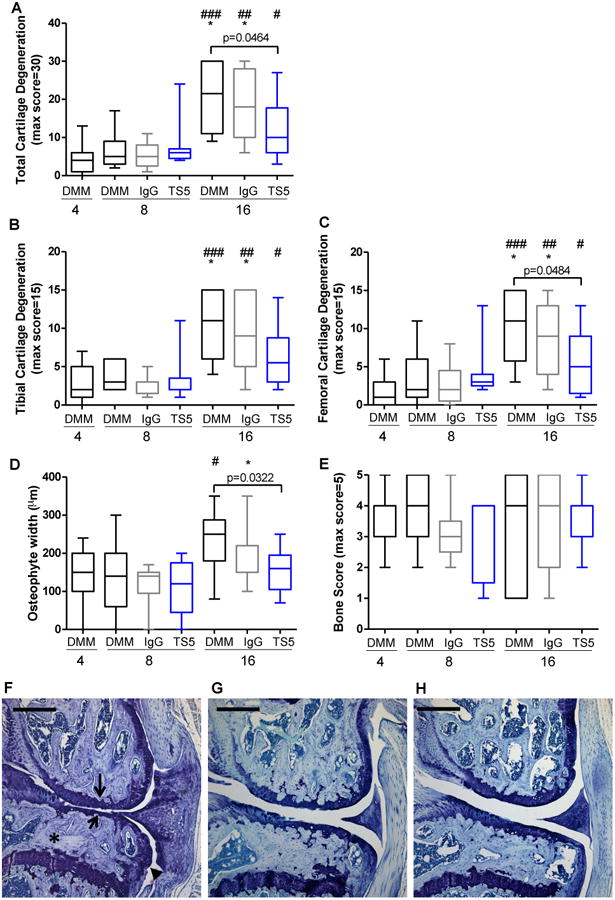
A) Total cartilage degeneration score in the medial compartment, #p=0.015 DMM+4 vs DMM+TS5+16; ##p=0.0014 DMM+4 vs DMM+IGG+16; *p=0.0116 DMM+IGG+8 vs DMM+IGG+16; ###p=0.0002 DMM+4 vs DMM+16; *p=0.0149 DMM+8 vs DMM+16; B) Medial tibial cartilage degeneration score, #p=0.0319 DMM+4 vs DMM+TS5+16; ##p=0.0046 DMM+4 vs DMM+IGG+16; *p=0.0119 DMM+IGG+8 vs DMM+IGG+16; ###p=0.0007 DMM+4 vs DMM+16; *p=0.013 DMM+8 vs DMM+16; C) Medial femoral cartilage degeneration score, #p=0.0188 DMM+4 vs DMM+TS5+16; ##p=0.002 DMM+4 vs DMM+IGG+16; *p=0.0299 DMM+IGG+8 vs DMM+IGG+16; ###p=0.0003 DMM+4 vs DMM+16; *p=0.0333 DMM+8 vs DMM+16; D) Osteophyte width, *p=0.0208 DMM+IGG+8 vs DMM+IGG+16; #p=0.0496 DMM+4 vs DMM+16; and E) Subchondral bone score were assessed 4, 8, and 16 weeks post DMM surgery in mice that were untreated (DMM), treated with IgG2c isotype control mAb (IgG), or treated with ADAMTS-5 mAb (TS5). Whiskers = 5-95 percentile; n=7-12 (details in Materials and Methods). Bar shows p-value for comparisons among treatment groups at a particular time point. F-H) Representative histology images of the medial knee joint compartment from mice 16 weeks after DMM surgery receiving F) no treatment, G) IgG isotype control Ab, or H) ADAMTS5 mAb starting 4 weeks after DMM. Images were chosen for mice representing the median histology scores from each treatment group based on the measures quantified in Figure 2A,D,E. In part F, arrows indicate medial femoral and tibial cartilage degeneration, an asterisk indicates tibial subchondral bone sclerosis, and the arrowhead indicates a tibial osteophyte. Scale bar = 0.5 mm.