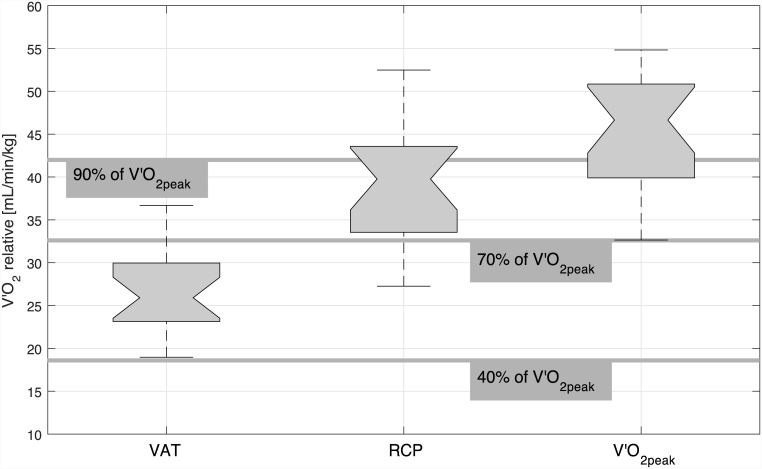
Fig 4. Mean ventilatory anaerobic threshold (VAT), respiratory compensatory point (RCP), and peak oxygen uptake (V′O2peak) of the repeated trials.
Boxplots show the median (with interval endpoints), the 25th and 75th percentiles (interquartile range, IQR) and the 99.3% coverage (1.5 x IQR). The 40%, 70%, and 90% ranges of V′O2peak are given for orientation.

