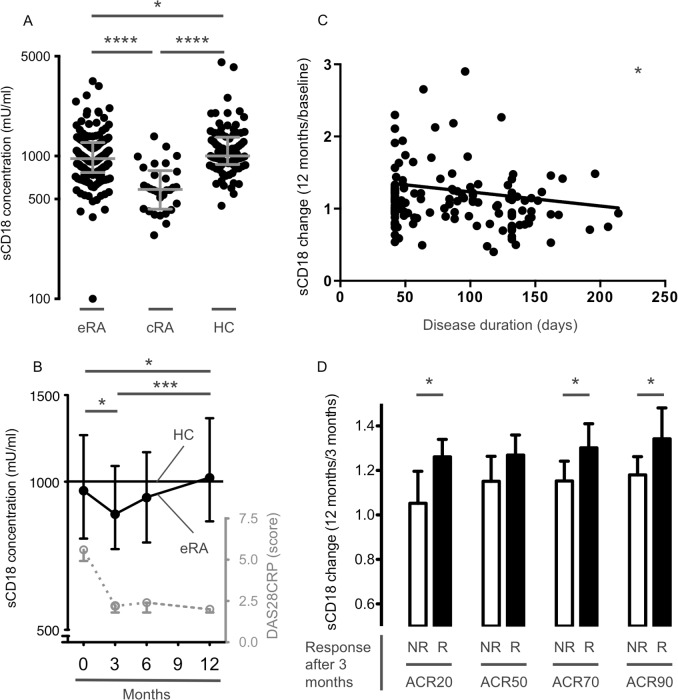
Fig 1. Plasma levels of sCD18 in 152 early treatment naïve RA (eRA) patients during 12 months of treatment, 30 chronic RA (cRA) patients, and 88 healthy controls (HC).
(A) Plasma levels of sCD18 in early RA patients at the time of inclusion, in chronic RA patients, and in HCs. Lines indicate median and whiskers indicate IQR. Data were analyzed using the student’s t-test on log-transformed data. (B) Plasma levels of sCD18 in RA patients during 12 months of treatment. Symbols and lines indicate median and IQR. DAS28CRP score serves as a measure of clinical disease (symbols and lines indicate median and IQR). Data were analyzed with the paired t-test on log-transformed data. (C) Association between ratio of the change in plasma sCD18 levels from baseline to 12 months after treatment and disease duration. Data were analyzed using the Spearman correlation. (D) Ratio of the change in plasma sCD18 levels from 3 to 12 months after treatment in ACR non-responders (NR) and ACR responders (R) after 3 months of treatment. The mean increase in plasma levels of sCD18 from 3 to 12 months after treatment was greater in ACR responders compared with ACR non-responders. Boxes and error bars indicate mean and 95% CI. Data were analyzed using the student’s t-test. Months indicate time after inclusion (treatment initiation). * P < 0.05, *** P < 0.001, and **** P < 0.0001.

