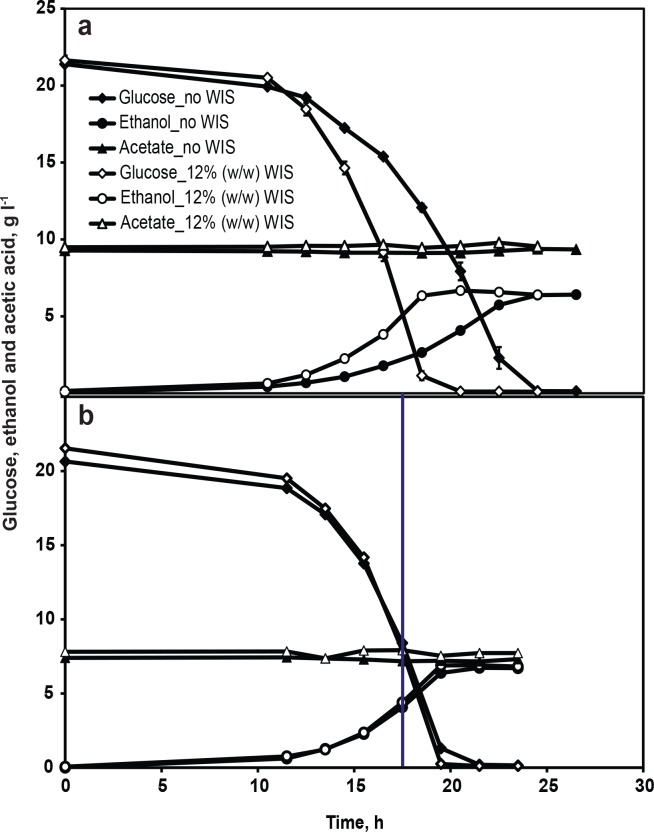
Fig 4. Influence of WIS on fermentation performance in the presence of acetic acid.
Glucose consumption (diamonds), ethanol production (circles) and acetic acid conversion (triangles) in minimal medium with 2% (w/w) glucose in the presence of (a) 9 g l-1 of acetic acid and (b) acetic acid concentration of 7.5 g l-1 that was used for the proteome study and a straight line at 17.5 h indicates the time of sampling for the total protein extraction. Open and closed symbols represent experimental conditions in the presence of 12% (w/w) WIS and no WIS, respectively. Data in Fig 4a and 4b represent the mean of biological duplicates and triplicates, respectively. Error bars, representing the standard deviation, are smaller than the symbols to be visible.

