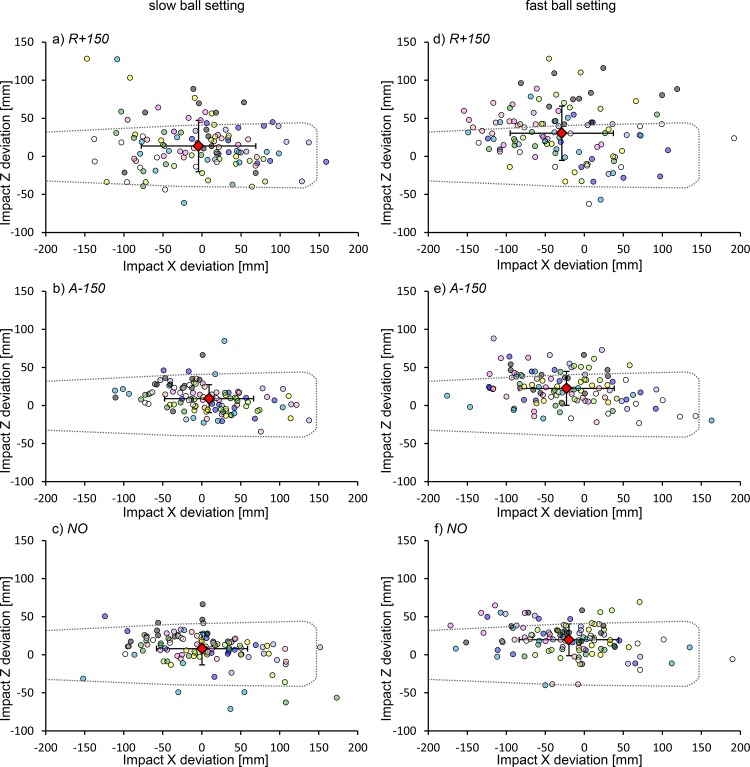
Fig 2. Scatter plot of the location of the ball center at the moment of ball-bat contact in all trials.
The dashed line represents the barrel of the bat. The diamond symbol indicates the mean location of the distribution. The vertical and horizontal bars represent the mean SDs for the impact X and Z deviations for each participant. Each circle color corresponds to the data from one participant. (a) R+150 condition in the slow ball setting. (b) A-150 condition in the slow ball setting. (c) NO condition in the slow ball setting. (d) R+150 condition in the fast ball setting. (e) A-150 condition in the fast ball setting. (f) NO condition in the fast ball setting.

