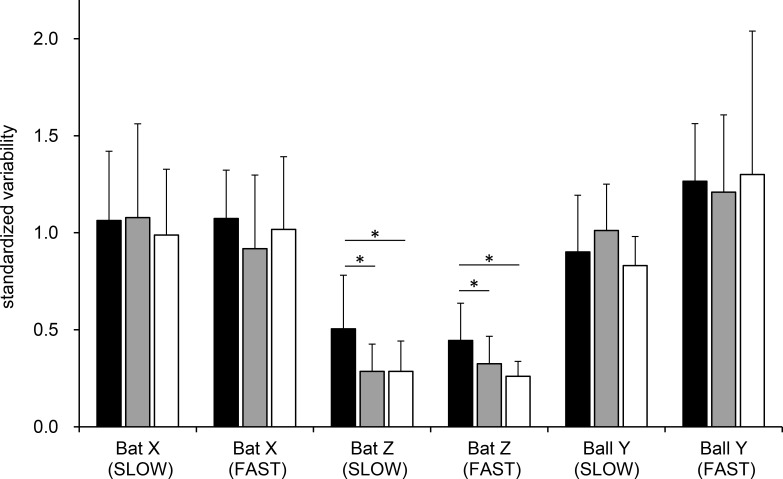
Fig 4. Standardized variability (mean + standard deviation) of the ball-bat contact location for each subject for the impact X deviation (Bat X), impact Z deviation (Bat Z), and timing (Ball Y) under the slow ball setting (SLOW) and fast ball setting (FAST).
Variability for Bat X and Bat Z were calculated using standardized SDs for the impact X deviation and impact Z deviation with SDs for the arrived ball location in the Xglobal and Zglobal directions. Variability for Ball Y was calculated using a standardized SD for the ball location at ball-bat contact in the Yglobal direction with a SD for the expected ball location in the Yglobal direction at the time of the average ball flight time of all the trials, with the measured ball speed of each trial. Each color of the bar represents an occlusion condition: black, R+150, gray, A-150, and white, NO. (*Standardized variability of the impact Z deviation under both ball speed settings was significantly larger in the R+150 condition than in the A-150 and NO conditions [p < 0.05]).

