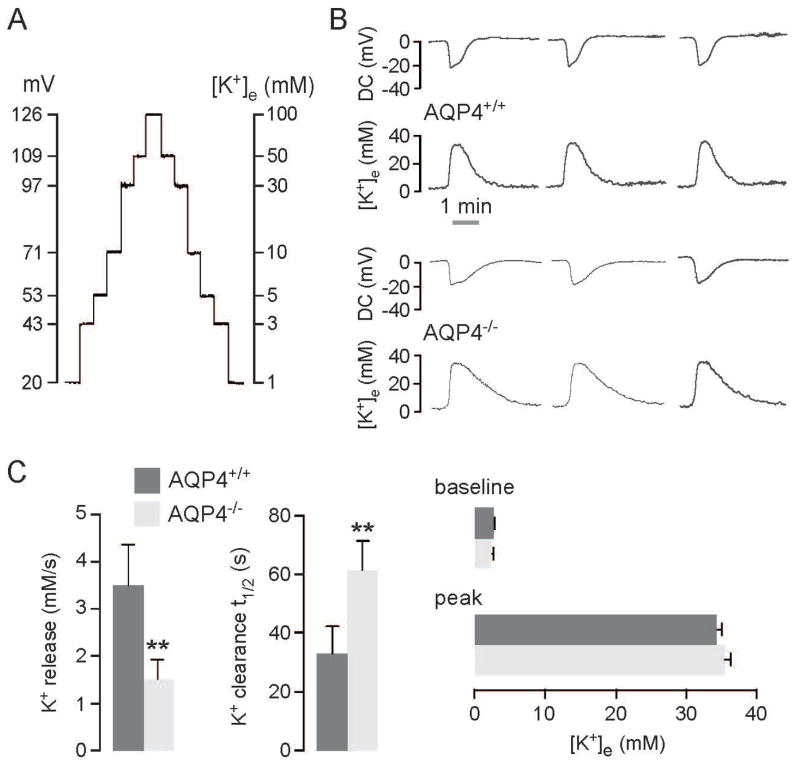
Figure 2.
In vivo recording of extracellular space K+ concentration during CSD. A. Calibration curve for K+-sensitive microelectrode using K+ solution standards containing 1, 3, 5, 10, 30, 50 and 100 mM KCl. Calibrations were done for the same microelectrode before and after each in vivo measurement. B. CSD was induced as in Fig. 1A. Representative K+ and DC potential recordings from three AQP4+/+ and AQP4−/− mice. C. (left) Rate (in mM/s) of increase in K+ increase (K+ release), and exponential time constant (in s−1) for K+ recovery to baseline (K+ clearance). (right) Baseline and peak K+ concentrations. Data shown for 6 mice per group (mean ± SEM, ** p < 0.01).

