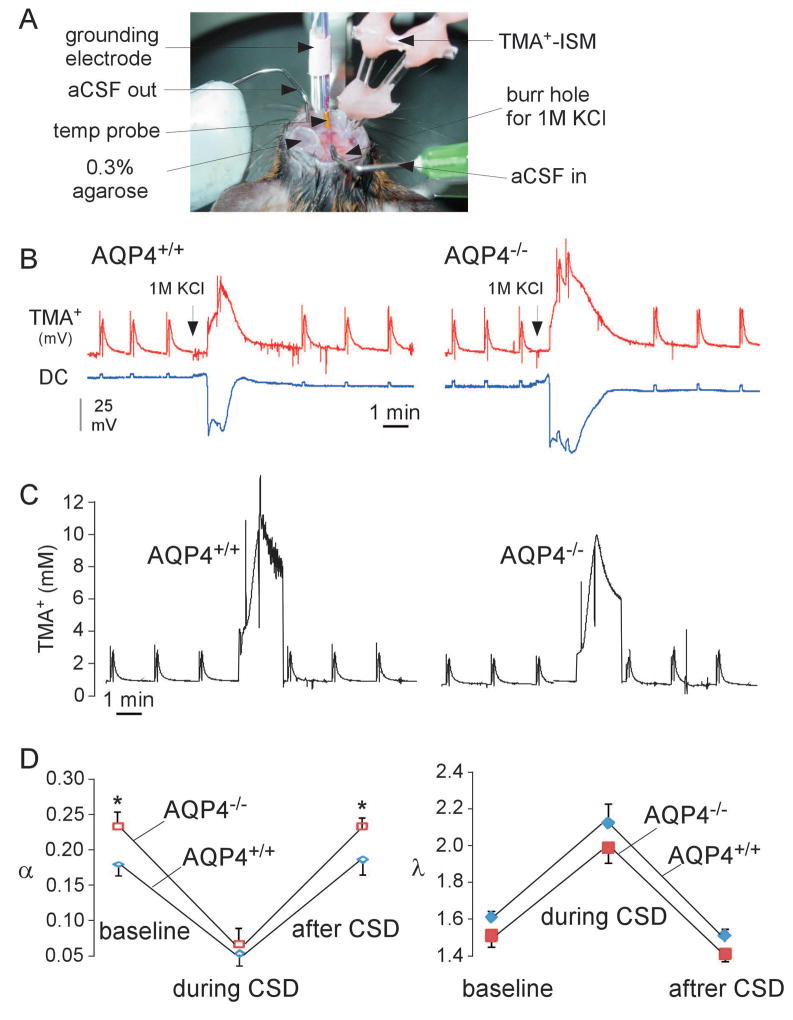
Figure 3.
In vivo measurement of ECS volume and tortuosity during CSD. A. Experimental setup for TMA+ diffusion measurements showing the immobilized mouse head and an array of microelectrodes with fixed inter-tip distance, adjacent to a grounding electrode and a temperature probe. B. Representative original recordings from TMA+-sensitive microelectrode and DC potential. Spikes initiated by 4 s-pulsed iontophoresis of TMA+. C. Deduced kinetics of TMA+ concentration from curves in B. A non-zero concentration of TMA+ in brain tissue was maintained by continuous application of a small bias current (20 nA). D. Averaged ECS volume fraction (α) and tortuosity (λ) (mean ± SEM, 4 mice per group, *p < 0.05).

