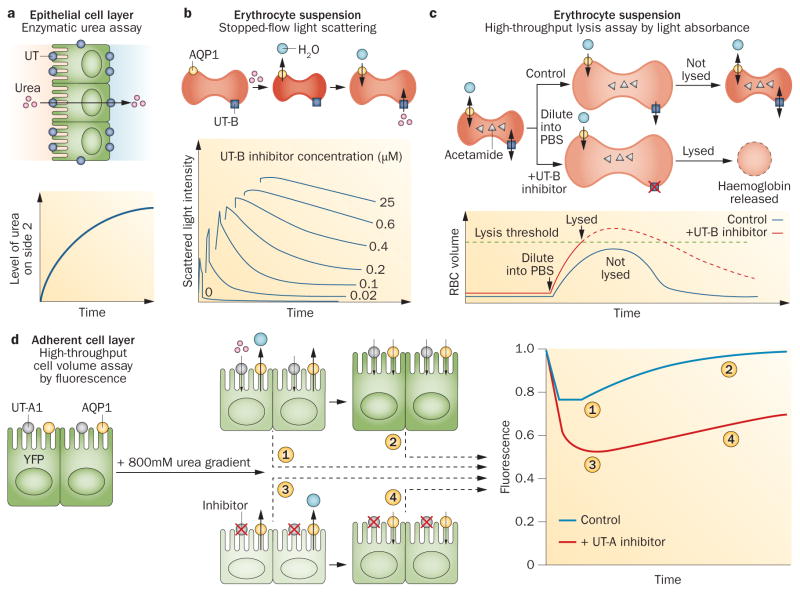
Figure 4.
Assays of UT-mediated urea transport. a | UT-mediated transport increases urea levels on side 2 over time. b | UT-B inhibition prevents cell reswelling after shrinkage. Scattered light intensity decreases as cells swell (bottom), and swelling kinetics are slowed with UT-B inhibition. c | UT-B inhibition impairs acetamide exit in an isosmolar external buffer, leading to lysis when water entry increases erythrocyte volume beyond a threshold (bottom). Dashed curve shows the hypothetical progression of erythrocyte volume without lysis. d | An inwardly directed urea gradient causes water efflux and cell shrinkage, detected as reduced YFP fluorescence. UT-A1 inhibition slows subsequent cell swelling, detected as an increase in YFP fluorescence. Abbreviations: AQP1, aquaporin-1; PBS, phosphate-buffered saline; RBC, red blood cell; UT, urea transporter; YFP, yellow fluorescent protein. Permission obtained for parts b and c from the Federation of American Societies for Experimental Biology © Levin, M. H. et al. FASEB J. 21, 551–563 (2007). Part d reprinted from Chemistry & Biology 20, Esteva-Font, C. et al., A small molecule screen identifies selective inhibitors of urea transporter UT-A. 1235–1244, © 2013, with permission from Elsevier.

