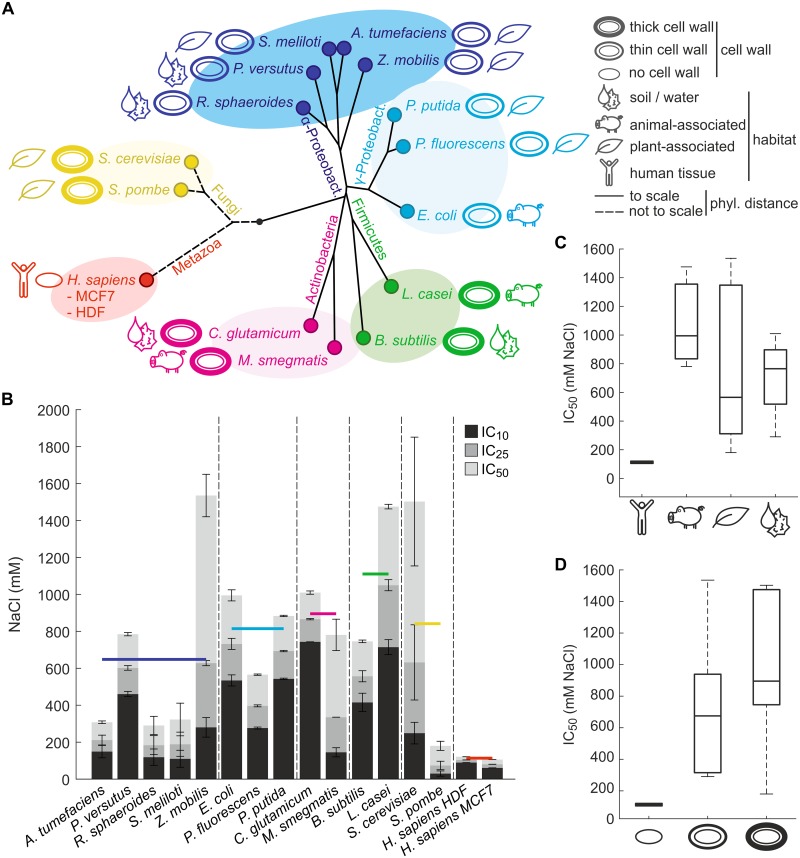
Fig 1. Analysis of salt tolerance in fifteen diverse species.
(A) Phylogenetic tree of analyzed species. Jukes-Cantor distances between bacteria are drawn to scale based on aligned 16S small ribosomal subunit RNA sequences. Distances between eukaryotes are not drawn to scale for visualization purposes. Organisms are colored based on taxonomic classification, and cell wall strengths and typical habitats are indicated. Further information about strains and cell lines is provided in S1 Table. (B) Sustained hyperosmotic salt tolerance based on growth inhibition experiments. Salt tolerance is expressed as mean and standard deviation (n = 2) of concentrations inhibiting growth rates by 10% (IC10), 25% (IC25) and 50% (IC50) compared to unstressed conditions. Species are grouped according to taxonomic classification, and the colored horizontal bars indicate the average IC50 of each taxonomic group. (C) Comparison of salt tolerance between species colonizing different habitats. (D) Comparison of salt tolerance between species with different cell wall strengths. Differences between groups in panels B to D were not statistically significant (P > 0.05, unpaired two-tailed t-tests) for all comparisons except those with human cell lines.

