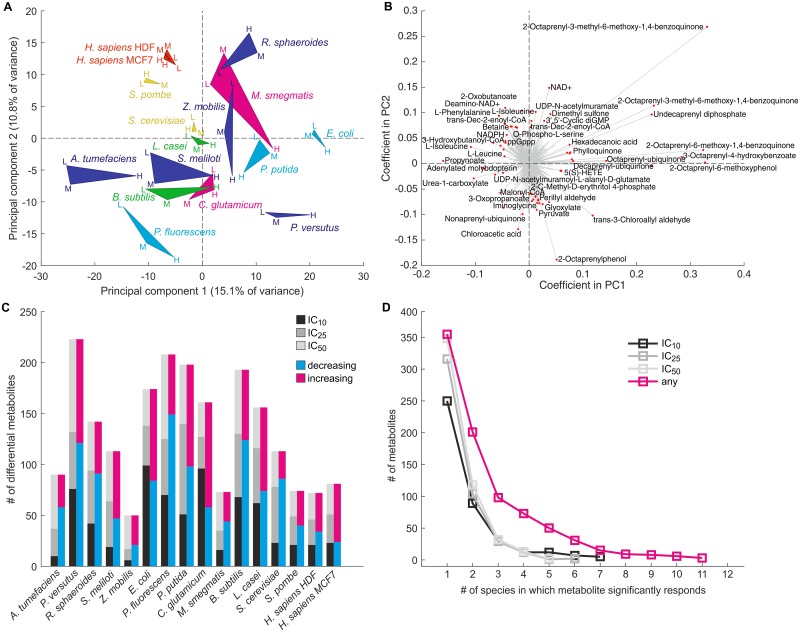
Fig 3. Hyperosmotic salt stress elicits complex and predominantly species-specific global metabolic responses.
(A) Principal component analysis (PCA) was performed based on log2 metabolite ion fold-changes upon low (IC10, L), medium (IC25, M) or high (IC50, H) salt stress relative to unstressed controls. For each species the three stress intensity points are connected by triangular patches for visualization purposes. Patches and labels are colored according to taxonomic classification as defined in Fig 1A. (B) Loading plot of metabolites underlying the PCA shown in panel A. Selected metabolites with large coefficients are highlighted. Note that metabolite annotations are based on accurate mass and can be ambiguous; refer to S1 Data for complete annotations. (C) Numbers of strongly and significantly responding metabolites in each analyzed species, grouped either by the lowest stress intensity under which a change was observed (gray bars) or by change direction (magenta and blue bars). (D) Histogram of the number of species in which metabolite ions were affected by the individual salt stress intensities (black, dark gray and light gray curves) or by at least one stress intensity (magenta curve).

