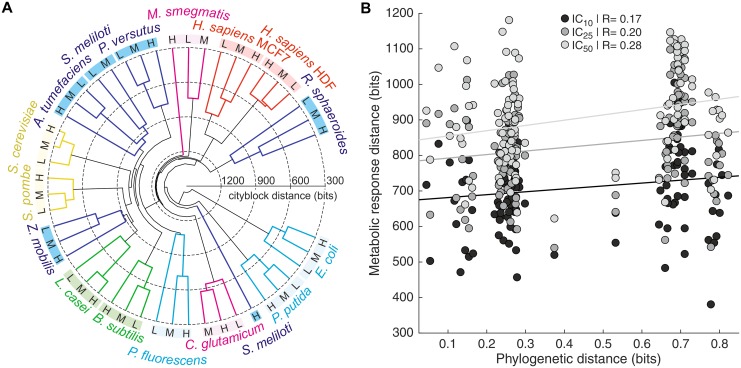
Fig 4. Phylogenetic relationship between species is insufficient to explain differences in metabolic salt stress responses.
(A) Cladogram of analyzed species based on metabolite ion log2 fold-changes upon exposure to low (IC10, L), medium (IC25, M) and high (IC50, H) salt stress relative to unstressed controls (IC0). Pairwise distances between samples were calculated using the Cityblock metric. Species labels are colored according to taxonomic classification as defined in Fig 1A. (B) Correlation of pairwise distances between species based on metabolic salt stress responses with phylogenetic distances. Distances between metabolic responses to different salt stress severities were calculated based on metabolite ion log2 fold-changes relative to IC0 using the Cityblock metric, and phylogenetic distances based on the aligned small ribosomal subunit RNA sequences using the Jukes-Cantor measure. R indicates Pearson’s correlation coefficient.

