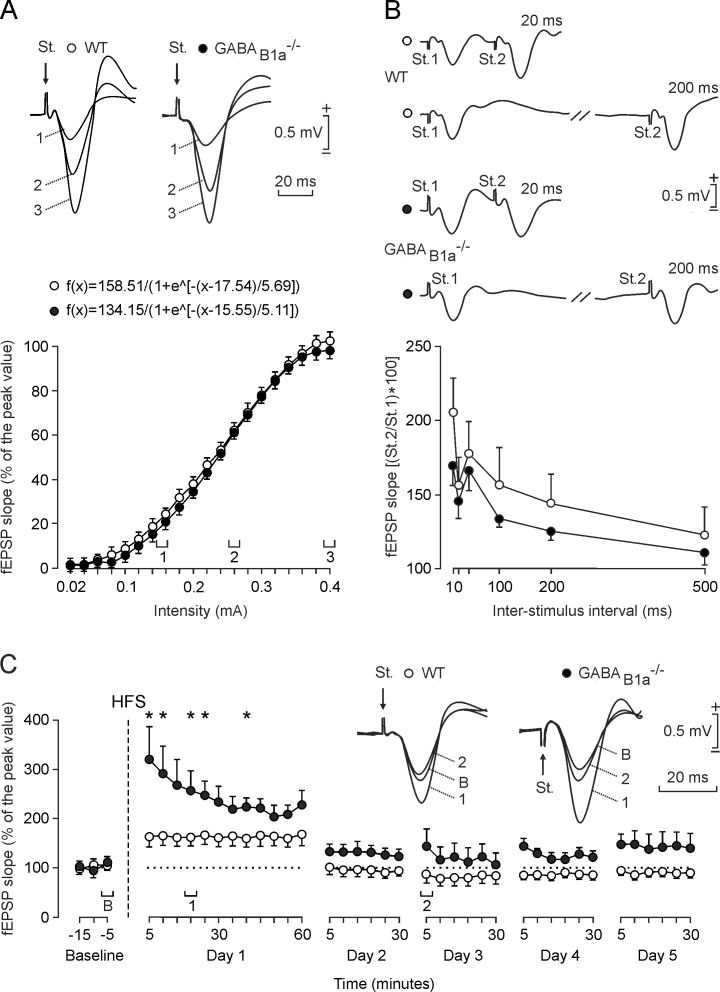
Fig 3. GABAB1a-/- mice exhibit increased LTP of evoked fEPSPs in the CA1 area while input/output curves and paired-pulse facilitation are normal.
(A) Input/output curves for the CA3-CA1 synapse. A single (100 μs, biphasic) pulse was presented to Schaffer collaterals at increasing intensities (from 0.02 mA to 0.4 mA, in steps of 0.02 mA) while recording evoked fEPSPs in the CA1 area for WT (open circles) and GABAB1a-/- (closed circles) mice. Representative fEPSPs recorded from the stratum radiatum evoked with the intensities indicated in the graph (1, 2, 3) are shown at the top for each genotype. Equations corresponding to the best (r ≥ 0.996; P < 0.0001) sigmoid fits of the data [mean ± SEM; n ≥ 8 mice and ≥ 40 measurements for each of the 20 different stimulus intensities applied] are indicated. (B) Paired-pulse facilitation at the CA3-CA1 synapse. The graph shows the slopes of the second fEPSPs expressed as a percentage of the first (mean ± SEM) for six inter-stimulus intervals (10, 20, 40, 100, 200, and 500 ms). WT and GABAB1a-/- mice exhibited paired-pulse facilitation at intervals of 10–200 ms (P < 0.01) that was not significantly different between the genotypes (P = 0.342). Representative recordings at 20 ms (top) and 200 ms (bottom) of inter-stimulus interval are shown on top (open circles for WT and closed circles for GABAB1a-/-). (C) Time course of LTP in the CA1 area (fEPSP mean ± SEM) following HFS. The HFS was presented after 15 min of baseline recording, at the time marked by the dashed line. The fEPSP is given as a percentage of the baseline (100%) slope. WT and GABAB1a-/- mice showed a significant increase (ANOVA, two-tailed) in fEPSP slope following HFS when compared to baseline at day 1 (P < 0.001). fEPSP slope values were significantly (*, P ≤ 0.03) larger for GABAB1a-/- than WT mice during the 5 days of recording. fEPSPs collected from WT (open circles) and GABAB1a-/- (closed circles) mice before (baseline, B) and after (1, 2) HFS of Schaffer collaterals are shown on top.

