
Fig 4. Scatter plot depicting the relationship between A260/230 (A, C & E) and A260/280 (B, D & F) ratios and mean depth of read coverage.
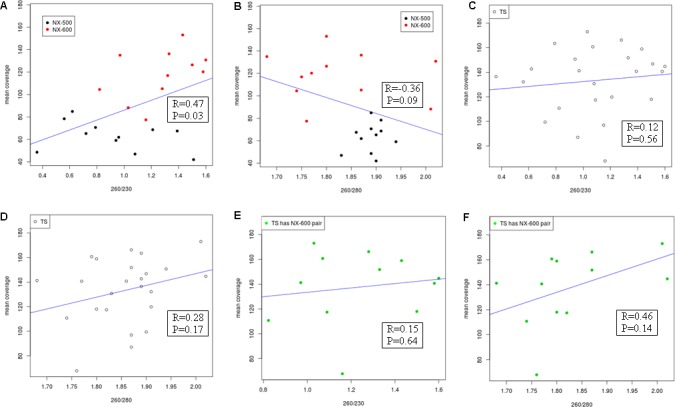
Blue lines illustrate the line of best fit. Isolates deemed outliers, with mean sequencing depth of coverage <25x or >195x, have been excluded. Pearson correlation values and corresponding linear regression p-values are expressed.