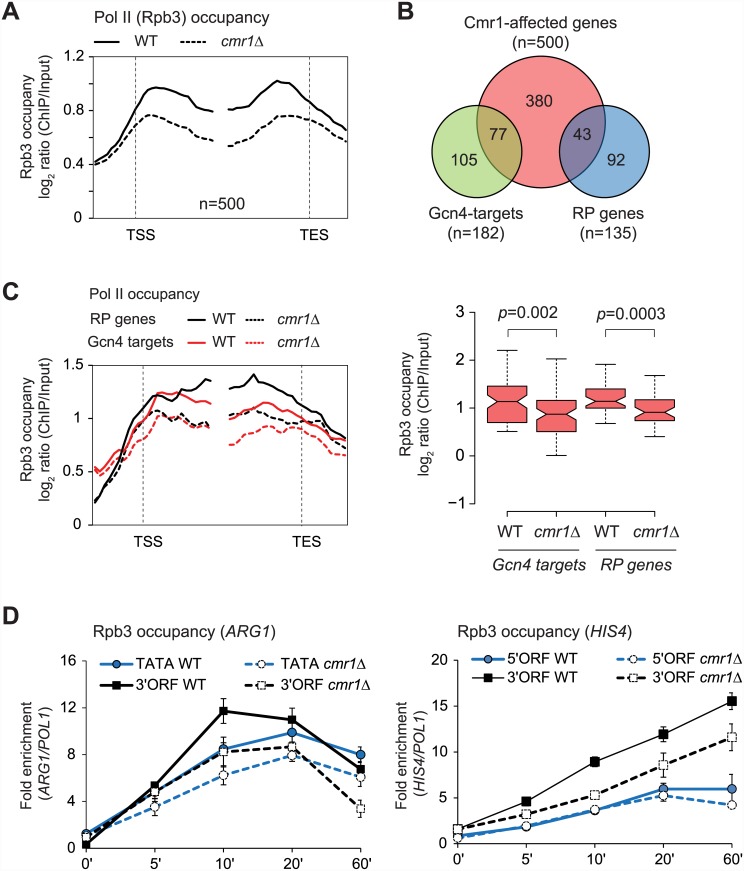
Fig 6. Cmr1 promotes transcription of ARG1 and HIS4.
A) Pol II occupancy profile for the 500 genes (among those genes harboring average Rpb3 occupancies >0.5 log2 ratio) showing the greatest Rpb3 binding defect in cmr1Δ cells. B) Venn diagram showing enrichment of Gcn4 and RP (ribosomal protein) genes among the top 500 Cmr1-affected genes. C) Rpb3 enrichments at the Gcn4 (n = 77) and RP genes (n = 43) among the top 500 Cmr1-affected genes (left) and gene average profile (right) in WT and cmr1Δ are shown. Notches represent 95% confidence intervals for each median. D) Rpb3 occupancy at the indicated regions of ARG1 (left) and HIS4 (right) was determined at various time-points during induction by ChIP in the WT and cmr1Δ strain.

