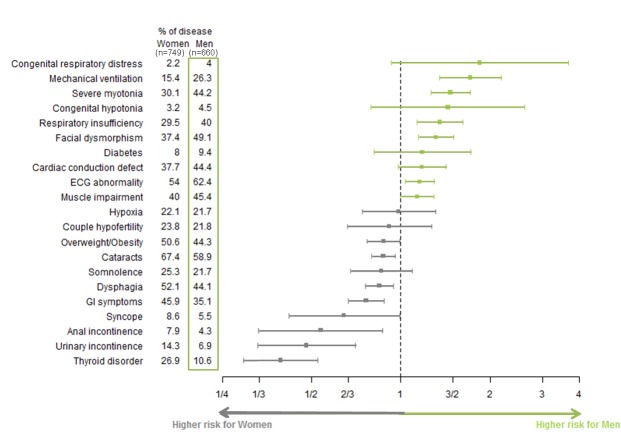
Fig 4. Gender impact on severity of symptoms expressed as risk ratio on 95% confidence interval.
This diagram represents the gender relative risk ratio value for each symptom with its 95% confidence interval (segment). A risk ratio is significant if the confidence interval does not cross the vertical line at value 1. The width of confidence interval depends on estimate standard deviation and consequently on observations number.

