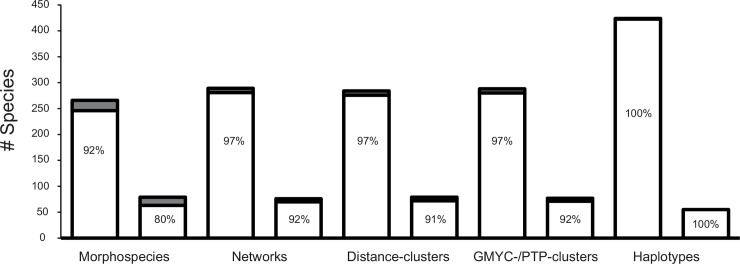
Fig 5. Barplots illustrating occurrence of species at elevational levels.
Percentage of morphospecies, networks, distance- and GMYC-/PTP-clusters and haplotypes found at one (white) or two (grey) elevational levels. Complete dataset (left column) and dataset without singletons and doubletons (right column).

