Fig 3.

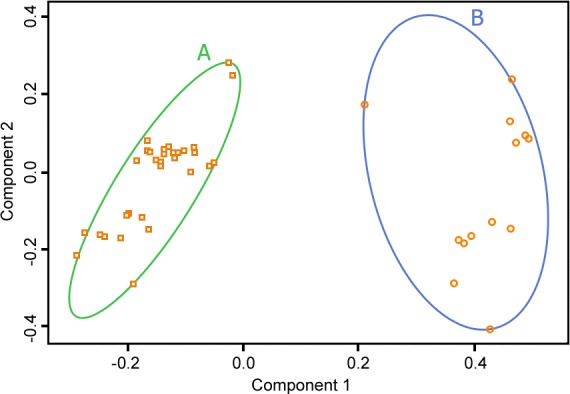
Principal Component plot (Component 1 vs Component 2) for cluster analysis based on the C-terminal EBNA-1 Sanger sequences revealed two distinct populations of 47 (A) and 15 (B) cases.

Principal Component plot (Component 1 vs Component 2) for cluster analysis based on the C-terminal EBNA-1 Sanger sequences revealed two distinct populations of 47 (A) and 15 (B) cases.